Questions tagged [charts]

Charts are a graphical representation of data, most often in the format of a graph or diagram. Use this tag for questions about using a charting library API.

Charts are a graphical representation of data, using dots, lines, bars, geometric figures or other graphical elements. They can help you visualize vast amounts of data in a way that is easily understood. Similar to the saying "A picture is worth more than 1000 words", one may say "A chart is worth more than 1000 reports" ...

There are many different versions (types) of charts. Here are just a few examples of them:
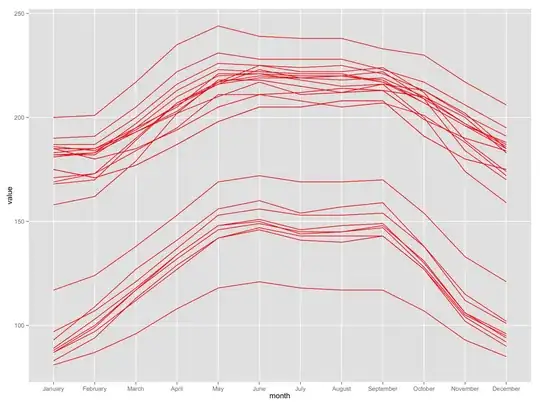
Pie Chart Bar Chart Combined Chart Funnel Chart


Related tags

26456 questions
5
votes
1 answer

How to make a Pie Chart Aggregate the Data Source?

Using Kendo UI Complete for ASP.NET MVC, version: 2013.3 1119 (Nov 20, 2013)... If I have this bit of code: $("#status-chart").kendoChart({ dataSource: { data: [ {Status: 10}, {Status: 20}, {Status:…
kmp
  • 10,535
  • 11
  • 75
  • 125
5
votes
2 answers

Best way to store status flag value in the table (char or int)

i need to have a column called status in the table. this status column can contain -> activated , expired, deactivated. so i am wondering why cant i create an integer type column called status and store them as 0, 1, 2 (expired, activated,…
dev1234
  • 5,376
  • 15
  • 56
  • 115
5
votes
2 answers

Format a time as hours:minutes on a Google Charts y-axis

I have a Google Chart where the y-axis is measured in minutes. How can I format the y-axis so the labels display the time in a format like 2hrs40, or 2:40, or something similar? I don't want to display the time in raw minutes, and I don't want to…
GMA
  • 5,816
  • 6
  • 51
  • 80
5
votes
1 answer

asp.net rendering a line chart

I have been trying to render a line chart using the basic asp.net Chart class. Whatever I do, it always renders a column chart. Here is my code where I am binding a datatable to the chart. var IEtable = (table as…
Kinnary Jangla
  • 123
  • 1
  • 6
5
votes
3 answers

Uncaught Error: Container is not defined

I'm trying to generate a gantt chart using Google charts and after coding accordingly with the existing php code, I m getting a blank html. Please help me on this to display the chart successfully.
Arun Kumar
  • 3,251
  • 4
  • 14
  • 10
5
votes
3 answers

.NET Chart Control: How to use a LineAnnotation?

I do have a working line chart with one series. Now I want to draw a custom line on it. I want to set the start and end point of this line in chart coordinates (like the datapoints in the series) and not in pixels. As far as I can tell from what I…
Rob
  • 11,492
  • 14
  • 59
  • 94
5
votes
2 answers

How can I plot only points (not lines) with flot?

Ultimately I'm after a very minimal 1 dimensional chart like this: Axes X-axis: 0 to 100, and invisible Y-axis: 0 to 0 (but -1 to 1 may be necessary to draw a three lines) Data Points only. No lines. Two data sets need to be colored…
Ryan
  • 14,682
  • 32
  • 106
  • 179
5
votes
11 answers

Chart controls for ASP.NET

I am looking people's opinion and experience on using chart controls within an ASP.NET application (web forms or MVC) primarily but also in any kind of project. I am currently doing my research and I have a pretty big list of controls to evaluate.…
tolism7
  • 2,351
  • 17
  • 25
5
votes
3 answers

WPF realtime chart application architecture

I have the following scenario in mind: I want to send (via serial port) some commands to a device. This device does send me back a continuous stream of data (max. 12000 values per second). To control some settings I need some buttons to send…
user2799180
  • 719
  • 1
  • 11
  • 29
5
votes
2 answers

Getting Theme Color info from Chart Series

I have a chart series using one color (it can be an msoThemeColorAccent<#> or any other) for the marker line, another color for the marker fill (it can be an msoThemeColorAccent<#>, lighter x%, or any other), and no lines. I want to determine if the…
5
votes
1 answer

google visualizations align 0 axis with two different y-axes

I'm creating a combochart with google's visualization library. I'm charting a store's traffic and revenue over the course of a day. I have set my draw options to var options = { seriesType: "bars", …
Devin Crossman
  • 7,454
  • 11
  • 64
  • 102
5
votes
1 answer

Dynamic series in Kendo UI Bar Chart

I' ve spent a few hours on this problem and can't seem to figure out how to solve it. I'm trying to create a stacked bar chart like this: http://demos.kendoui.com/dataviz/bar-charts/stacked-bar.html I'm using ASP.NET MVC (Razor). Here is some sample…
cah1r
  • 1,751
  • 6
  • 28
  • 47
5
votes
6 answers

JavaFX LineChart / AreaChart wrong sorted values on x-axis (CategoryAxis)

When trying to build an application which contains an updateable LineChart or AreaChart I recognized strange behaviour - probably due to an error in application logic? The goal is to fill data into or update a chart when a button "Generate" is…
user2858153
  • 51
  • 1
  • 4
5
votes
3 answers

Rails + charts.js: How to fill out the Javascript array with value from database?

I would like to use Google visualization charts for displaying information into a graph. The javascript function for setting value into the graph looks like this: function drawLineChart(chartType) { if(chartType == undefined) { …
user984621
  • 46,344
  • 73
  • 224
  • 412
5
votes
1 answer

Removing the white line between slices in Flot pie chart

How can I remove the white line between slices and background in Flot pie chart? My jsfiddle As you can see it looks like that: I want it to look like that(Ignore my bad artistic skills): My Code: $(function () { var data = [ { label:…
Canttouchit
  • 3,149
  • 6
  • 38
  • 51