Questions tagged [charts]

Charts are a graphical representation of data, most often in the format of a graph or diagram. Use this tag for questions about using a charting library API.

Charts are a graphical representation of data, using dots, lines, bars, geometric figures or other graphical elements. They can help you visualize vast amounts of data in a way that is easily understood. Similar to the saying "A picture is worth more than 1000 words", one may say "A chart is worth more than 1000 reports" ...

There are many different versions (types) of charts. Here are just a few examples of them:
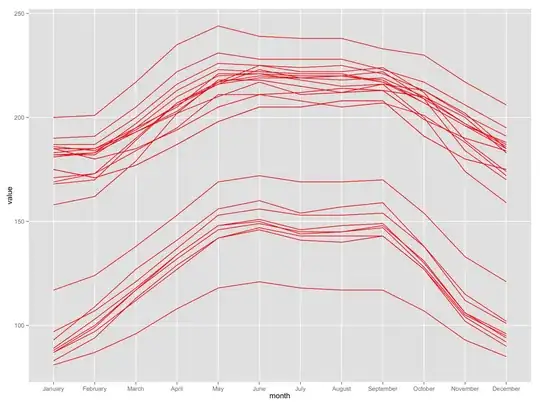
Pie Chart Bar Chart Combined Chart Funnel Chart


Related tags

26456 questions
114
votes
5 answers

Android charting libraries

I am trying to find a fast and reliable charting library. After some searching, I found 4 libraries: AChartEngine [warning! official website is down and redirects to virus filled website!], WilliamChart, HelloCharts and AndroidPlot. I need some up…
user3488996
  • 1,339
  • 2
  • 10
  • 13
113
votes
5 answers

How do you plot bar charts in gnuplot?

How do you plot bar charts in gnuplot with text labels?
tatwright
  • 37,567
  • 6
  • 21
  • 9
111
votes
11 answers

Disable Animation with Charts.js

I'm having some trouble turning off the animation with charts.js. This is my code: var pieData = [ { value: 30, color:"#F38630" }, { value : 50, color : "#E0E4CC" }, { value : 100, …
Cronner
  • 1,135
  • 2
  • 7
  • 8
110
votes
2 answers

Charts for Android

I am working on a project which have some charts (graphs), tick chart, candlestick chart and range chart. But the problem is, there is no library for that charts. I have got Google chart API for candlestick chart. But I don't want graph/chart in a…
ASP
  • 1,974
  • 3
  • 18
  • 30
101
votes
4 answers

Comparison between d3.js and chart.js (only for charts)

I have used chart.js in my projects several times but I have never used d3.js. A lot of people say that d3.js is the best javascript framework for charts but none of them is able to explain why, especially when I want a comparison to chart.js. I…
mendrugory
  • 1,185
  • 2
  • 9
  • 12
89
votes
10 answers

Remove x-axis label/text in chart.js

How do I hide the x-axis label/text that is displayed in chart.js ? Setting scaleShowLabels:false only removes the y-axis labels.