Questions tagged [charts]

Charts are a graphical representation of data, most often in the format of a graph or diagram. Use this tag for questions about using a charting library API.

Charts are a graphical representation of data, using dots, lines, bars, geometric figures or other graphical elements. They can help you visualize vast amounts of data in a way that is easily understood. Similar to the saying "A picture is worth more than 1000 words", one may say "A chart is worth more than 1000 reports" ...

There are many different versions (types) of charts. Here are just a few examples of them:
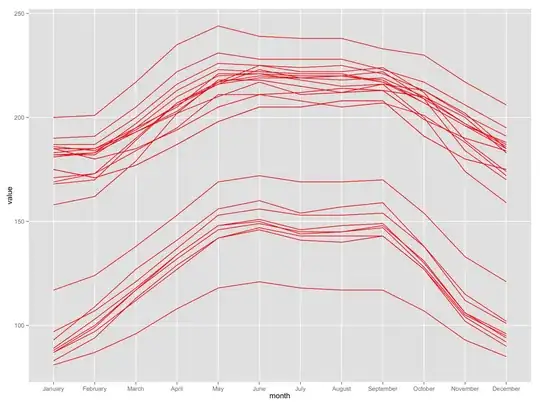
Pie Chart Bar Chart Combined Chart Funnel Chart


Related tags

26456 questions
5
votes
1 answer

Google Pie chart: remove white gap between pie slices

Similar to this question, but for Google Pie Charts: How can I remove the white lines between the slices on a Google Pie Chart: On the image above, I want to remove the white space highlighted by the green arrow.
Rob
  • 6,304
  • 24
  • 83
  • 189
5
votes
1 answer

Interactive Charts in Tcl/Tk

BLT is the best choice I know. It works, but the style is a little bit outdated. And i suppose it's out of maintenance? Since the lastest 2.4z was release in 2002. Plotchart is another great chart library which is part of tklib and already builin in…
Alec
  • 1,178
  • 5
  • 20
5
votes
2 answers

How to format the Y axis values on Rickshaw Graphs

I want to use the Javascript graphs of http://code.shutterstock.com/rickshaw/ and I got it working for one exception, when my values of less than 0.00000100 then the y-axis values are shown in scientific format, e.g. 2e-7 for the value…
KKK
  • 1,085
  • 11
  • 33
5
votes
1 answer

Determining the value of a point in Excel VBA

I am trying to have the points in a chart change color if they are within certain value paramaters (i.e., >1 is green, <1 is red, anything else is blue). I cannot determine how to get VBA to give me the value of any given point. In this thread,…
Joe
  • 53
  • 1
  • 1
  • 3
5
votes
3 answers

ShinobiCharts:How can show the X value and Y value when u click the point of the chart

I am now using ShinobiCharts iOS chart framework. Can anyone please give me a example that provide the function as the following image? I want to do the function which can show the X value and Y value when u click the point of the chart.
nullmicgo
  • 407
  • 4
  • 19
5
votes
1 answer

Conditional background color in line charts

I am currently trying to convert our charts over from PQ Systems Chartrunner to SSRS 2008 charts. I am currently working with a line chart in SSRS 2008 and am trying to get the background color to change for the different sigmas. I am able to…
user1368059
  • 73
  • 1
  • 6
5
votes
1 answer

JavaScript dynamic Line Charts with many points (~500,000)

I am surveying JavaScript charting solutions for building interactive dashboards. The dashboard is going to have 15 charts, each with 6 lines, and each line has ~5000 points (15 * 6 * 5000 = 450,000). And a new point will be appended (and an old…
anglee
  • 51
  • 2
5
votes
2 answers

Changing Axis Labels on Excel Chart created in C#

So I've been trying to figure this out for a while now but can't seem to get anywhere. I'm creating an Excel spreadsheet using C#. My spreadsheet contains a chart. I'm able to do everything with the chart EXCEPT change the X-Axis labels. I've tried…
Pete
  • 181
  • 1
  • 1
  • 8
5
votes
2 answers

Stacked bar plot in R with multiple rows per day

I would like to display work done in a day as a stacked bar plot, in order to see, day by day, how much activity I've done in each category, with the Y-axis representing time from 0:00 to 23:59. # day tstart tend duration…
fniessen
  • 4,408
  • 19
  • 18
5
votes
1 answer

d3js axis dates start and end value only

Resolved: Thanks, the tickValues gave me the wanted result. I used the values from d3.min and d3.max: var xMin = d3.min(groups, function(c) { return d3.min(c.values, function(v) { return v.date; }); }); var xMax = d3.max(groups, function…
Bjarte
  • 2,167
  • 5
  • 27
  • 37
5
votes
1 answer

Extract maxima of the peaks by a treshold from a JFreeChart XYLineChart

I want to implement a feature to a JFreeChart with a XYLineChart. So, for now I have a XYLineChart and I want to find the x-value depending the center of the peaks (see attached figure to understand what I want). So, I want to implement a threshold…
5
votes
5 answers

3D scatter plots and 3D graph visualization in Java

I'm looking to create views of scientific data in Java. The data is a mathematical graph consisting of points in 3D space. Are there any Java-based frameworks for creating 3D graphs in Java so that I can: 1. Plot points as spheres, 2. Connect some…
Ben
5
votes
3 answers

Increase bar chart values with button clicks

I am trying to create a graph that will show the progress of a workout. Every five button clicks a tick should be added to the graph. This is a example of how it should look. For demonstration purposes I am using a button click, In production the…
user973671
  • 1,620
  • 6
  • 27
  • 39
5
votes
2 answers

How can I create a bar-chart with JFreeChart, that shortens too long bars with a visible hint?

I want to create a bar-chart, but extraordinary high values should be shortened. An example is this image: (source: epa.gov) I hope it is clear what I want. My question is: How can I do this with JFreeChart. If it isn't possible with JFreeChart…
Mnementh
  • 50,487
  • 48
  • 148
  • 202
5
votes
2 answers

Google Charts and real time updates

I'm thinking of using the google charts api, in particular column charts and scatter plots. I want to know that can these charts be updated constantly by data it receives from the server via a websocket. My understanding is that this data will first…
user1869421
  • 837
  • 5
  • 14
  • 22
1 2 3
99
100