Questions tagged [charts]

Charts are a graphical representation of data, most often in the format of a graph or diagram. Use this tag for questions about using a charting library API.

Charts are a graphical representation of data, using dots, lines, bars, geometric figures or other graphical elements. They can help you visualize vast amounts of data in a way that is easily understood. Similar to the saying "A picture is worth more than 1000 words", one may say "A chart is worth more than 1000 reports" ...

There are many different versions (types) of charts. Here are just a few examples of them:
Pie Chart Bar Chart Combined Chart Funnel Chart


Related tags

26456 questions
5
votes
2 answers

Calendar Time Series with R

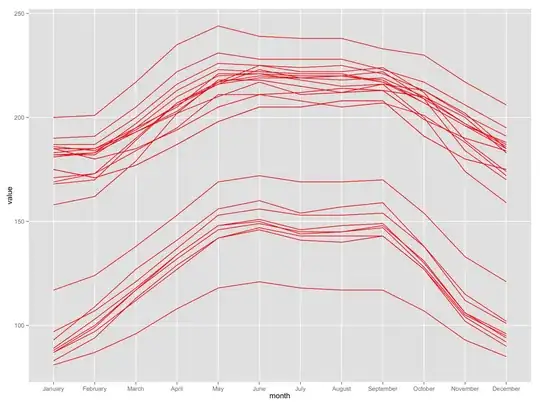
How to make calendar time series charts like this with ggplot2? I couldn't find anything so I went ahead and wrote it up.
TheComeOnMan
  • 12,535
  • 8
  • 39
  • 54
5
votes
1 answer

How to generate a chart from an Excel sheet?

I can generate an Excel file when I pass a datatable into the below function: public static void ExportDataTableToExcel(DataTable dt, string filepath) { object missing = Type.Missing; object misValue = System.Reflection.Missing.Value; …
user3467827
  • 83
  • 1
  • 1
  • 5
5
votes
2 answers

Delete Excel Chart

I want to delete a Chart from an Excel file. The Excel file is an automatically generated historyfile with a chart, the problem is, that every time I renew the history, it makes a new chart, but the old one must be deleted... This is my…
jochot
  • 167
  • 1
  • 13
5
votes
2 answers

Free WPF real time chart

I am looking for some simple line chart solution. I need that for my app written in wpf that is part of a final college exam. I was trying to find some, but I have found only paid solutions and because I need that just for this purpose I dont want…
BblackK
  • 524
  • 1
  • 8
  • 25
5
votes
2 answers

How do I create a timeline chart in Excel?

How do I create a timeline chat which visualizes peoples activities throughout a day in one graph? On the x-axis I plan to place the time. And the y-Axis would be the different persons. First, I thought of a simple stacked bar chart. However, the…
casaout
  • 1,819
  • 3
  • 24
  • 54
5
votes
4 answers

Removing (collapsing) DataPoints in a LineSeries?

I'd like to remove the datapoint markers from a LineSeries in my Silverlight chart. The only way i found on the web is to set the VisibilityProperty to Collapse. //not working in the current SL toolkit release var collapseDataPointSetter = new…
devployment
  • 2,121
  • 1
  • 22
  • 33
5
votes
2 answers

How do we set the position of an Excel chart from C#?

I am trying to generate an Excel chart from C#. Chart is generated just find but it allways appears at the center of the screen. How can I set the position of the chart? Thanks. My code looks like this: Microsoft.Office.Interop.Excel._Workbook ebook…
slhsen
  • 606
  • 9
  • 21
5
votes
4 answers

MSDN charts changing point values realtime?

I want to use MSDN charts to represent realtime data i'm getting from a telnet application. For testing purpose i have added a button to alter the chart manually. I manually made the chart and it has 0 to 5 points on the X axis with values different…
Madmenyo
  • 8,389
  • 7
  • 52
  • 99
5
votes
3 answers

Creating Data "Tiles" for Massive Amounts of Price Data

I'm designing a JavaScript chart that I want to be awesome and I need your help. Let's say I have 5 million records with price data like this: open high low close volume timeStart timeEnd timeDuration 10 20 5 15 500 …
Kirk Ouimet
  • 27,280
  • 43
  • 127
  • 177
5
votes
10 answers

Charts in webpages

What I'd like to accomplish is to present charts on webpages. For example aspx pages gridviews that present a two column table are able to be copied & placed into Excel then a chart created. The pages I currently use most are ASP.NET 3.0 or…
Catto
  • 6,259
  • 2
  • 52
  • 55
5
votes
2 answers

VBA looping through all series within all charts

I'm having an issue with the looping through of several charts in my VBA code. I'm 99.7% sure that this is a really easy and quick fix but my brain isn't working today. I want the code to loop through every chart on the ActiveSheet, and for every…
Tanaka Saito
  • 943
  • 1
  • 17
  • 40
5
votes
1 answer

How to add axis labels for row chart using dc.js or d3.js

For Bar Chart and Stacked Chart, we can use .xAxisLabel("X Axis Label") and .yAxisLabel("Y Axis Label") functions to add labels for respective axis. But, Is there any way to add axis labels for Row Chart?
Bhatu Pawar
  • 53
  • 1
  • 4
5
votes
1 answer

Create a chart in Excel using C#

I'm having some trouble creating charts in Excel with C#. I've managed to get a chart of any kind working with the following code: Excel.Range chartRange; Excel.ChartObjects xlCharts =…
David Archer
  • 1,154
  • 6
  • 18
  • 34
5
votes
0 answers

How to do nice statistics charts in Android?

I want to do some really nice stastics charts like Expense Manager, Runtastic, etc. Any idea how to do them? Is there an API to do that? I want something like this:
Alejandro Cumpa
  • 2,118
  • 1
  • 24
  • 45
5
votes
1 answer

How to plot animated line chart using d3 while the data table is required to be updated every 1 second?

I want to simulate the situation where there is continuous incoming real time (dynamic) data and feed to the chart Therefore, I try to demonstrate an animated line chart using d3 while the data array is required to be continuous updated every 1…
jhyap
  • 3,779
  • 6
  • 27
  • 47