Questions tagged [charts]

Charts are a graphical representation of data, most often in the format of a graph or diagram. Use this tag for questions about using a charting library API.

Charts are a graphical representation of data, using dots, lines, bars, geometric figures or other graphical elements. They can help you visualize vast amounts of data in a way that is easily understood. Similar to the saying "A picture is worth more than 1000 words", one may say "A chart is worth more than 1000 reports" ...

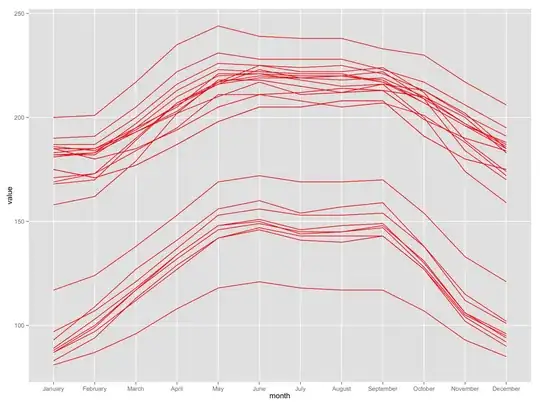
There are many different versions (types) of charts. Here are just a few examples of them:
Pie Chart Bar Chart Combined Chart Funnel Chart


Related tags

26456 questions
69
votes
12 answers

NG2-Charts Can't bind to 'datasets' since it isn't a known property of 'canvas'

I am trying to use the basic example of NG2-Charts (http://valor-software.com/ng2-charts/) I copy pasted the HTML part
Raphael Hippe
  • 4,535
  • 4
  • 13
  • 17
69
votes
10 answers

How to hide y axis line in ChartJs?

I am using bubble chart and gotta hide the y axis line. I've tried the following but it doesn't work. yAxes: [{ angleLines: { display: false } }]
dolftax
  • 1,209
  • 3
  • 12
  • 21
68
votes
7 answers

How do you create a family tree in d3.js?

I'm currently working on a small genealogy experiment and would like to implement a simple family tree like in the picture below. The best search results so far for this only yielded examples where a child can only have a parent node. But what I…
user659025
65
votes
7 answers

How to set ChartJS Y axis title?

I am using Chartjs for showing diagrams and I need to set title of y axis, but there are no information about it in documentation. I need y axis to be set like on picture, or on top of y axis so someone could now what is that parameter I have…
emir
  • 1,336
  • 1
  • 14
  • 33
63
votes
7 answers

Matplotlib: avoiding overlapping datapoints in a "scatter/dot/beeswarm" plot

When drawing a dot plot using matplotlib, I would like to offset overlapping datapoints to keep them all visible. For example, if I have: CategoryA: 0,0,3,0,5 CategoryB: 5,10,5,5,10 I want each of the CategoryA "0" datapoints to be set side by…
iayork
  • 6,420
  • 8
  • 44
  • 49
63
votes
3 answers

Chart.js Show labels on Pie chart

I recently updated my charts.js library to the most updated version (2.5.0). This version doesn't show the labels on the chart. I have an example of working one on fiddler: http://jsfiddle.net/g6fajwg8 . However, I defined my chart exactly as in the…
Jacob
  • 3,598
  • 4
  • 35
  • 56
62
votes
7 answers

How can I color dots in a xy scatterplot according to column value?

Consider the following worksheet: A B C D 1 COMPANY XVALUE YVALUE GROUP 2 Apple 45 35 red 3 Xerox 45 38 red 4 KMart 63 50 orange 5 Exxon 53 59 green I…
Pr0no
  • 3,910
  • 21
  • 74
  • 121
60
votes
5 answers

Chart Js Change Label orientation on x-Axis for Line Charts

I am using chart.js. Similar to this Question, I would like to rotate my x-axis labels 90 degrees. Currently my labels are rotated about 80 degrees with default settings. Could somebody help me adapt the bar-chart solution for rotating labels, so…
Delcon
  • 2,355
  • 1
  • 20
  • 23
55
votes
6 answers

Chart.js how to get Combined Bar and line charts?

i would like to ask is that possible using Chart.js http://www.chartjs.org/ to get Combined Bar and line charts? Thanks for any advice.
redrom
  • 11,502
  • 31
  • 157
  • 264
54
votes
9 answers

How to add two Google charts on the one page?

What I've done I've added Google chart to the head of my page. This returns an image of a chart. What I need to do I simply need to add a second chart to the same page. The problem The code for the second chart is ignored. I largely suspect this is…
Dominor Novus
  • 2,248
  • 5
  • 29
  • 35
54
votes
4 answers

how to hide highchart x - axis data values

I am drawing a bar chart using highchart.js I do not want to show the x - axis data values. Can any one tell me which option does it? full config: var chart = new Highcharts.Chart({ chart: { renderTo: container, …
Nurul Asad
  • 541
  • 1
  • 4
  • 4
53
votes
3 answers

more than 9 subplots in matplotlib

Is it possible to get more than 9 subplots in matplotlib? I am on the subplots command pylab.subplot(449); how can I get a 4410 to work? Thank you very much.
relima
  • 3,462
  • 5
  • 34
  • 53
49
votes
10 answers

ChartJS: datalabels: show percentage value in Pie piece

I have a piechart with four labels: var data = [{ data: [50, 55, 60, 33], labels: ["India", "China", "US", "Canada"], backgroundColor: [ "#4b77a9", "#5f255f", "#d21243", "#B27200" ], borderColor:…
theKing
  • 714
  • 3
  • 14
  • 36
48
votes
9 answers

Show values on top of bars in chart.js

Please refer this Fiddle : https://jsfiddle.net/4mxhogmd/1/ I am working on chart.js If you see in fiddle, you will notice that value which is top on bar is not properly displayed in some cases(goes outside the canvas) While research I came across…
Kiran Shinde
  • 5,732
  • 4
  • 24
  • 41
48
votes
2 answers

SVG vs HTML5 Canvas Based Charts

I have to draw charts on browser using a python backend (which may not matter here). There are numerous libraries like JQPlot, D3, Google Charts for achieving this. But if you classify them, they are either HTML5 Canvas based or SVG based. Both are…
Vivek Jha
  • 1,520
  • 3
  • 16
  • 26