Questions tagged [charts]

Charts are a graphical representation of data, most often in the format of a graph or diagram. Use this tag for questions about using a charting library API.

Charts are a graphical representation of data, using dots, lines, bars, geometric figures or other graphical elements. They can help you visualize vast amounts of data in a way that is easily understood. Similar to the saying "A picture is worth more than 1000 words", one may say "A chart is worth more than 1000 reports" ...

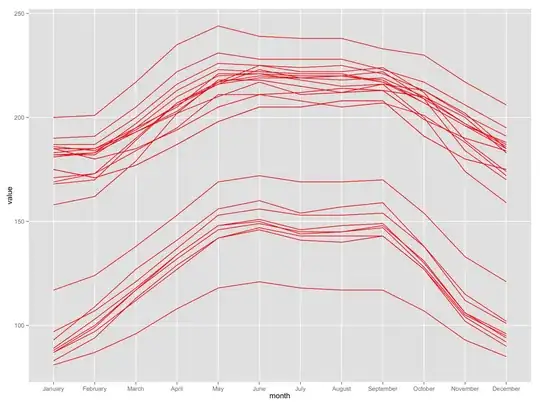
There are many different versions (types) of charts. Here are just a few examples of them:
Pie Chart Bar Chart Combined Chart Funnel Chart


Related tags

26456 questions
36
votes
5 answers

Chart creating dynamically. in .net, c#

Does anybody have some experience working with charts in .NET? Specially I want to create them programmatically. using System; using System.Collections.Generic; using System.ComponentModel; using System.Data; using System.Drawing; using…
KilyenOrs
  • 1,456
  • 1
  • 20
  • 26
35
votes
3 answers

Microsoft Charting, MVC 3 and Razor

Related to This topic I wonder if anyone has made the Microsoft Charting library working with Asp MVC 3 and Razor. I know about the new chart helper introduced, but since that is very limited that is not really an option. To create an action method…
Victor
  • 3,999
  • 3
  • 24
  • 27
35
votes
3 answers

Python matplotlib.pyplot pie charts: How to remove the label on the left side?

I plot a piechart using pyplot. import pylab import pandas as pd test = pd.Series(['male', 'male', 'male', 'male', 'female'], name="Sex") test = test.astype("category") groups = test.groupby([test]).agg(len) groups.plot(kind='pie',…
Marc
  • 383
  • 1
  • 3
  • 8
35
votes
6 answers

How to minimize whitespace around Baidu's echarts

I'm trying to incorporate Baidu's echarts (which look really good). However, there is a lot of whitespace around the actual graph when one doesn't set a title nor uses their toolbar. Is there a way to have the graph/chart use more of the canvas? My…
max.ott
  • 569
  • 1
  • 6
  • 16
35
votes
6 answers

JavaScript Charts API: Flot jQuery Plugin OR Google Visualization?

I am looking for a charts library to be displayed on a website. I will use intensively this library (for area, line and bar charts mainly), so I prefer to secure my choice before starting implementing. The list of website chart libraries that I have…
fabien7474
  • 16,300
  • 22
  • 96
  • 124
35
votes
6 answers

How do I make a burn down chart in Excel?

I have several books I want to finish reading by a certain date. I'd like to track my progress completing these books, so I decided to try making a simple burn down chart. The chart should be able to tell me at a glance whether I'm on track to…
Mag Roader
  • 6,850
  • 8
  • 32
  • 27
34
votes
6 answers

Any good client-side open-source dashboard framework?

I am looking to build a client-side dashboard framework where a user can create a new dashboard, add portlets, position them along a grid system, resize, close, .... The dashboard look and feel should be controllable with CSS. I am looking for a…
Paolo Bozzola
  • 1,153
  • 2
  • 10
  • 14
34
votes
6 answers

Reasonable optimized chart scaling

I need to make a chart with an optimized y axis maximum value. The current method I have of making charts simply uses the maximum value of all the graphs, then divides it by ten, and uses that as grid lines. I didn't write it. Update Note: These…
Grant
  • 11,799
  • 13
  • 42
  • 47
34
votes
4 answers

How to generate graphs and charts from mysql database in php

How can I generate graphs and charts from a mysql database using php? I'm trying to use "chart director" but I can't even install it properly, because I'm using php version 5.3, and it's using a deprecated function dl. Do you know of any…
Wern Ancheta
  • 22,397
  • 38
  • 100
  • 139
34
votes
11 answers

asp.net:Invalid temp directory in chart handler configuration [c:\TempImageFiles\]

I am getting this error Invalid temp directory in chart handler configuration [c:\TempImageFiles\]. While running my code. Intially I was getting No http handler was found for request type ‘GET’ error which I solved it by referring no http…
veda
  • 6,416
  • 15
  • 58
  • 78
34
votes
2 answers

How do I create a timeline chart which shows multiple events? Eg. Metallica Band members timeline on wiki

How do I create a timeline chart which shows multiple events? Eg. Metallica Band members timeline on wiki ? where it shows the multiple band members and their durations. Technologies to be used : Microsoft Office primarily. Any exotic technology…
Achow
  • 8,600
  • 6
  • 39
  • 49
33
votes
4 answers

Free easy way to draw graphs and charts in C++?

I am doing a little exploring simulation and I want to show the graphs to compare the performance among the algorithms during run-time. What library comes to your mind? I highly prefer those that come small as I'd love if it's easy for my instructor…
syaz
  • 2,659
  • 6
  • 36
  • 44
33
votes
4 answers

Displaying graphs/charts in Django

I'm making a report app in Django that involves plenty of graphs and charts. Is there an easy graphing library/module that allows me to achieve this workflow: Execute my SQL queries Parse the returned data to the graphing library/module Graphing…
super9
  • 29,181
  • 39
  • 119
  • 172
33
votes
3 answers

Chartjs random colors for each part of pie chart with data dynamically from database

I want to set dynamically a color for each part of Pie Chart. Since the chart is dynamically created from database I want for each part that is added to the chart(from database) a different color. I was trying to do…
Nda.S
  • 419
  • 1
  • 6
  • 12
33
votes
8 answers

customize highcharts tooltip to show datetime

I'm developing a project that is expected to show this graph: http://jsfiddle.net/Kc23N/ When I click a point (tooltip) I want to show a date understandable, not the value in milliseconds. I think needs to change this piece of code: tooltip: { …
SkyNet_citizen
  • 475
  • 1
  • 8
  • 12