Questions tagged [charts]

Charts are a graphical representation of data, most often in the format of a graph or diagram. Use this tag for questions about using a charting library API.

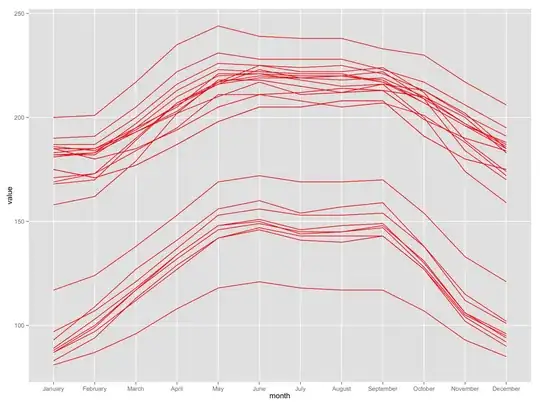
Charts are a graphical representation of data, using dots, lines, bars, geometric figures or other graphical elements. They can help you visualize vast amounts of data in a way that is easily understood. Similar to the saying "A picture is worth more than 1000 words", one may say "A chart is worth more than 1000 reports" ...

There are many different versions (types) of charts. Here are just a few examples of them:

Pie Chart Bar Chart Combined Chart Funnel Chart


Related tags

26456 questions
33
votes
2 answers

jQPlot - remove vertical grid lines

I am using jqPlot as my charting framework and have numerous charts in my application, primarily line and stacked bar charts. I now have a requirement to only show the horizonal grid lines on these charts and do not see any options in jqPlot to do…
nolt2232
  • 2,594
  • 1
  • 22
  • 33
32
votes
8 answers

How do you remove the x-axis from a bar chart produced by Google's Visualization API?

Referring to the kind of chart shown here: http://code.google.com/apis/visualization/documentation/gallery/barchart.html There doesn't seem to be a simple switch, and changing the axis color to white (on a white background) didn't seem to do…
Dan
32
votes
4 answers

Using plotly without online plotly account

Is it possible to use the plotly library to create charts in python without having an online plotly account? I think the code is opensource https://github.com/plotly/plotly.py. I would like to know whether we can use this without an online account.
Harnish
  • 811
  • 2
  • 11
  • 14
32
votes
5 answers

Chart.js v2: How to make tooltips always appear on pie chart?

I have found similar questions in Stack Overflow, but all of them were addressed one and two years ago. Now Chart.js has come up in version 2, and lots of the documentation changes. Can someone please help me showing an example of pie chart with…
Danny
  • 543
  • 1
  • 5
  • 14
32
votes
5 answers

c# chart change max and min values on the x axis

Can someone tell me how to change the min and max values on the x axis on a C# chart? I want to go from 0 to 13, but it goes from -1 to 14 right now.
Matthew The Terrible
  • 1,589
  • 5
  • 31
  • 53
31
votes
4 answers

Highchart specific width stack column bar graph

Need to find a way to represent a graph with error bar, but it seems that it's not supporting in the highchart at the moment. My plan is to use a stack column bar chart with 0 to lower Y as transparent, and lower Y to upper Y with a red color or…
Gäng Tian
  • 1,588
  • 2
  • 18
  • 26
31
votes
3 answers

Implementing Target lines, in SSRS column Charts

I have a column graph, that shows a trend of consumption over time, The y-axis being consumption and x-axis being time in month, I have to implement a target consumption. I implemented a target, by adding data field with a Line chart type, this is…
Brian Paul
  • 651
  • 2
  • 12
  • 21
31
votes
5 answers

"Container is not defined" Google chart

I have solved my issue but can't answer it myself since I am too new to this site: turns out I needed to use the following: chart = new google.visualization.PieChart(document.getElementById('pie_today_div')); I was using JQuery to access the…
Mike
  • 321
  • 1
  • 3
  • 6
31
votes
7 answers

Zoomable, Google-Finance-style time series graph in D3 or Rickshaw?

I want to create a time series line graph in D3, with a smaller version of the graph below that allows the user to zoom in on certain sections of the chart, like a Google Finance graph. The closest example I've found is this swimlane…
Richard
  • 62,943
  • 126
  • 334
  • 542
30
votes
9 answers

Alternative to Google Visualization's Annotated Timeline? (graphing library)

Is there any alternative to Google's Annotated Timeline Visualization API? There's some bugs in the Annotated Timeline, and it doesn't appear they will be addressed. Also it is a Flash based chart. A Canvas+Javascript implementation would be more…
Ian Boyd
  • 246,734
  • 253
  • 869
  • 1,219
30
votes
2 answers

Is Google Chart Tool Api is free to use

Is Google Chart API free to use? If so, where can I find its documentation?
agarwal_achhnera
  • 2,582
  • 9
  • 55
  • 84
30
votes
3 answers

C3JS - Cannot read property 'category10' of undefined

I tried this c3.js code from jsfiddle (https://jsfiddle.net/varunoberoi/mcd6ucge) but it doesn't seem to work in my localhost. I'm using uniserver as my server. I copy-paste everything but it's not working.
JJC
  • 493
  • 1
  • 6
  • 10
30
votes
7 answers

Flot pie chart gives error in firebug: "uncaught exception: Invalid dimensions for plot, width = null, height = null"

I using flot pie chart for plotting pie charts. but it shows error in firebug that uncaught exception: Invalid dimensions for plot, width = null, height = null I have given the height and width from stylesheet also. and tried also like this…
user1662343
  • 303
  • 1
  • 3
  • 4
29
votes
12 answers

Real-time Java graph / chart library?

There was an earlier thread on Java graph or chart library, where JFreeChart was found to be quite good, but, as stated in its FAQ, it's not meant for real-time rendering. Can anyone recommend a comparable library that supports real-time rendering?…
Joonas Pulakka
  • 36,252
  • 29
  • 106
  • 169
29
votes
8 answers

Chart.js Add Commas to Tooltip and Y-Axis

I've tried some several answers here in stackoverflow but to no avail failed to make it work.. I'm really new in Chart.js so please bear with me. this is what I have tried so far. Add Commas to ChartJS Data Points and this Chart.js number…
Sam Teng Wong
  • 2,379
  • 5
  • 34
  • 56