36

Does anybody have some experience working with charts in .NET? Specially I want to create them programmatically.

using System;
using System.Collections.Generic;
using System.ComponentModel;
using System.Data;
using System.Drawing;
using System.Linq;
using System.Text;
using System.Windows.Forms;
using System.Windows.Forms.DataVisualization.Charting;
using System.Diagnostics;

namespace WindowsFormsApplication6
{
  public partial class Form1 : Form
  {
    public Form1()
    {
        InitializeComponent();
    }

    private void Form1_Load(object sender, EventArgs e)
    {
        Random rnd = new Random();
        Chart mych = new Chart();
        mych.Series.Add("duck");

        mych.Series["duck"].SetDefault(true);
        mych.Series["duck"].Enabled = true;
        mych.Visible = true;

        for (int q = 0; q < 10; q++)
        {
            int first = rnd.Next(0,10);
            int second = rnd.Next(0,10);
            mych.Series["duck"].Points.AddXY(first, second);
            Debug.WriteLine(first + "  " + second);
        }
        mych.Show();
        Controls.Add(mych);
        mych.Show();
    }
  }
}

I'm trying to use .NET (.net 4, Visual Studio 2010) chart, but the random generated data set, doesn't appear. The chart remained blank. I searched for examples and only found ones like this , and, yes with manual "drag" method it works. I have no idea why the data I programmatically generate doesn't appear.
silentsod
  • 8,165
  • 42
  • 40
KilyenOrs
  • 1,456
  • 1
  • 20
  • 26

5 Answers5

65

Yep.

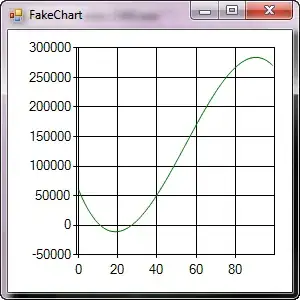
// FakeChart.cs
// ------------------------------------------------------------------
//
// A Winforms app that produces a contrived chart using
// DataVisualization (MSChart).  Requires .net 4.0.
//
// Author: Dino
//
// ------------------------------------------------------------------
//
// compile: \net4.0\csc.exe /t:winexe /debug+ /R:\net4.0\System.Windows.Forms.DataVisualization.dll FakeChart.cs
//

using System;
using System.Windows.Forms;
using System.Windows.Forms.DataVisualization.Charting;


namespace Dino.Tools.WebMonitor
{
    public class FakeChartForm1 : Form
    {
        private System.ComponentModel.IContainer components = null;
        System.Windows.Forms.DataVisualization.Charting.Chart chart1;

        public FakeChartForm1 ()
        {
            InitializeComponent();
        }

        private double f(int i)
        {
            var f1 = 59894 - (8128 * i) + (262 * i * i) - (1.6 * i * i * i);
            return f1;
        }

        private void Form1_Load(object sender, EventArgs e)
        {
            chart1.Series.Clear();
            var series1 = new System.Windows.Forms.DataVisualization.Charting.Series
            {
                Name = "Series1",
                Color = System.Drawing.Color.Green,
                IsVisibleInLegend = false,
                IsXValueIndexed = true,
                ChartType = SeriesChartType.Line
            };

            this.chart1.Series.Add(series1);

            for (int i=0; i < 100; i++)
            {
                series1.Points.AddXY(i, f(i));
            }
            chart1.Invalidate();
        }

        protected override void Dispose(bool disposing)
        {
            if (disposing && (components != null))
            {
                components.Dispose();
            }
            base.Dispose(disposing);
        }

        private void InitializeComponent()
        {
            this.components = new System.ComponentModel.Container();
            System.Windows.Forms.DataVisualization.Charting.ChartArea chartArea1 = new System.Windows.Forms.DataVisualization.Charting.ChartArea();
            System.Windows.Forms.DataVisualization.Charting.Legend legend1 = new System.Windows.Forms.DataVisualization.Charting.Legend();
            this.chart1 = new System.Windows.Forms.DataVisualization.Charting.Chart();
            ((System.ComponentModel.ISupportInitialize)(this.chart1)).BeginInit();
            this.SuspendLayout();
            //
            // chart1
            //
            chartArea1.Name = "ChartArea1";
            this.chart1.ChartAreas.Add(chartArea1);
            this.chart1.Dock = System.Windows.Forms.DockStyle.Fill;
            legend1.Name = "Legend1";
            this.chart1.Legends.Add(legend1);
            this.chart1.Location = new System.Drawing.Point(0, 50);
            this.chart1.Name = "chart1";
            // this.chart1.Size = new System.Drawing.Size(284, 212);
            this.chart1.TabIndex = 0;
            this.chart1.Text = "chart1";
            //
            // Form1
            //
            this.AutoScaleDimensions = new System.Drawing.SizeF(6F, 13F);
            this.AutoScaleMode = System.Windows.Forms.AutoScaleMode.Font;
            this.ClientSize = new System.Drawing.Size(284, 262);
            this.Controls.Add(this.chart1);
            this.Name = "Form1";
            this.Text = "FakeChart";
            this.Load += new System.EventHandler(this.Form1_Load);
            ((System.ComponentModel.ISupportInitialize)(this.chart1)).EndInit();
            this.ResumeLayout(false);
        }

        /// <summary>
        /// The main entry point for the application.
        /// </summary>
        [STAThread]
        static void Main()
        {
            Application.EnableVisualStyles();
            Application.SetCompatibleTextRenderingDefault(false);
            Application.Run(new FakeChartForm1());
        }
    }
}

UI:

enter image description here

user
  • 5,335
  • 7
  • 47
  • 63
Cheeso
  • 189,189
  • 101
  • 473
  • 713
  • 1
    Thank you! I'm trying to find out, witch was to problem with my code. Is great that finally i have a working example. And google, finds, basically nothing, like this. – KilyenOrs May 16 '12 at 18:25
  • For anyone searching on this, you have to replace components inside of program.cs and form1.designer.cs as this code isn't meant to be incorporated within another application as a default. Next I will try and figure that part out. – Bbb Jan 27 '20 at 16:20
  • That's an ugly double vertical line at the vertical axis. I suggest setting `chart.ChartAreas[0].AxisX.IsMarginVisible = false` – Wyck Mar 11 '20 at 02:35
7

Microsoft has a nice chart control. Download it here. Great video on this here. Example code is here. Happy coding!

  • 2
    A good link. Note it is for .NET 3.5. .NET 4+ has the new Chart class in [System.Windows.Forms.DataVisualization.Charting](http://msdn.microsoft.com/en-us/library/system.windows.forms.datavisualization.charting.chart.aspx). –  Oct 31 '13 at 05:02
6

Add a reference to System.Windows.Form.DataVisualization, then add the appropriate using statement:

using System.Windows.Forms.DataVisualization.Charting;

private void CreateChart()
{
    var series = new Series("Finance");

    // Frist parameter is X-Axis and Second is Collection of Y- Axis
    series.Points.DataBindXY(new[] { 2001, 2002, 2003, 2004 }, new[] { 100, 200, 90, 150 });
    chart1.Series.Add(series);

}
eldarerathis
  • 35,455
  • 10
  • 90
  • 93
Rajnikant
  • 2,176
  • 24
  • 23
6

Try to include these lines on your code, after mych.Visible = true;:

ChartArea chA = new ChartArea();
mych.ChartAreas.Add(chA);
Sanoob
  • 2,466
  • 4
  • 30
  • 38
user3503997
  • 61
  • 1
  • 1
0

You need to attach the Form1_Load handler to the Load event:

using System;
using System.Collections.Generic;
using System.ComponentModel;
using System.Data;
using System.Drawing;
using System.Linq;
using System.Text;
using System.Windows.Forms;
using System.Windows.Forms.DataVisualization.Charting;
using System.Diagnostics;

namespace WindowsFormsApplication6
{
    public partial class Form1 : Form
    {
        public Form1()
        {
            InitializeComponent();
            Load += Form1_Load;
        }

        private void Form1_Load(object sender, EventArgs e)
        {
            Random rnd = new Random();
            Chart mych = new Chart();
            mych.Height = 100;
            mych.Width = 100;
            mych.BackColor = SystemColors.Highlight;
            mych.Series.Add("duck");

            mych.Series["duck"].SetDefault(true);
            mych.Series["duck"].Enabled = true;
            mych.Visible = true;

            for (int q = 0; q < 10; q++)
            {
                int first = rnd.Next(0, 10);
                int second = rnd.Next(0, 10);
                mych.Series["duck"].Points.AddXY(first, second);
                Debug.WriteLine(first + "  " + second);
            }

            Controls.Add(mych);
        }
    }
}
  • probably i'm the nob one, but only blank chart appears without data (with the exact code you wrote) It's possible that this is one of my mistakes, but not the only one for sure. Thanks for helping anyway. – KilyenOrs May 16 '12 at 18:46
  • @KilyenOrs `mych.Invalidate()` is the key. – Dejan Janjušević Nov 01 '13 at 18:16