Questions tagged [charts]

Charts are a graphical representation of data, most often in the format of a graph or diagram. Use this tag for questions about using a charting library API.

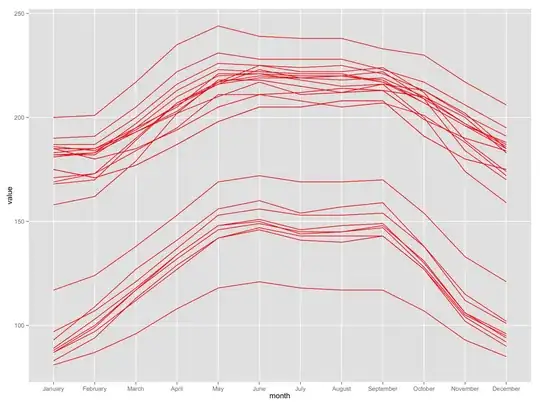
Charts are a graphical representation of data, using dots, lines, bars, geometric figures or other graphical elements. They can help you visualize vast amounts of data in a way that is easily understood. Similar to the saying "A picture is worth more than 1000 words", one may say "A chart is worth more than 1000 reports" ...

There are many different versions (types) of charts. Here are just a few examples of them:
Pie Chart Bar Chart Combined Chart Funnel Chart


Related tags

26456 questions
48
votes
2 answers

Repeated calls of Chart.SetSourceData give error 1004

I have a problem with an application that was created in Excel 2003 in my company. The application retrieves data from a source and updates a Chart using the SetSourceData in a VBA routine passing a Range containing the cells where the relevant data…
Pocerus
  • 483
  • 4
  • 5
47
votes
3 answers

Can Google Charts support dual y-axis (v-axis)?

The Flot chart api supports dual v-axis scales, as shown by this example. I'm using Google Charts - is this possible also with Google? I've had a look through the examples and docs, but can't find any examples / references to indicate it does…
Kevin
  • 11,521
  • 22
  • 81
  • 103
47
votes
4 answers

Automatic colors assignment in chart.js 2.x doesn't work anymore, used to work in v. 1.x

Using Chart.js 1.x I could create a pie chart and get the colors automatically assigned:
Eugenio
  • 3,195
  • 5
  • 33
  • 49
47
votes
8 answers

What is the algorithm to create colors for a heatmap?

Assuming values are normalized from 0 to 1, what is the algoritm to get a color to create a heatmap like this? 1 is red, .5 is green, 0 is dark blue. Working in RMagick / ImageMagick.
B Seven
  • 44,484
  • 66
  • 240
  • 385
45
votes
9 answers

Google Chart Background Color

I'm styling a google chart using the javascript api. I want to change the background of the area where the data is plotted. For some reason when I set background options like so: chart.draw(data, { backgroundColor: { fill: "#F4F4F4" } }) It changes…
firebait
  • 473
  • 1
  • 4
  • 7
45
votes
7 answers

Svg charting library

Do you know if there's any SVG + js charting library out there similar to http://www.amcharts.com/ (Flash). I need to provide nice looking interactive chart functionality in a browser that does not support Flash but supports SVG.
mleica
44
votes
4 answers

Draw horizontal line on chart in chart.js on v2

I have drawn a line chart using chart.js. For the labels and datasets i am getting values from the database. I am new to chart.js and its very powerful library, yet i am unable to completely understand it. I want to draw multiples horizontal lines.…
tech_geek
  • 1,624
  • 3
  • 21
  • 44
44
votes
7 answers

creating charts with angularjs

I've also been looking at charting solutions that will blend well with Angular.JS directives. I came across a few but got really confused. Does anyone have any suggestions for how to create interactive charts that are integrated with Angular.JS…
Hmahwish
  • 2,222
  • 8
  • 26
  • 45
43
votes
9 answers

Reordering Chart Data Series

How does one reorder series used to create a chart in Excel? For example, I go to the chart, right click > Select Data. In the left column I see series 1, series 2, to series n. Say, I want to move series 3 after series 4, can it be done from chart…
KM.
  • 1,382
  • 1
  • 19
  • 34
43
votes
3 answers

Using different font styles in annotate (ggplot2)

I'm using the code below to generate a simple chart with some annotations: require(ggplot2); data(mtcars) ggplot(mtcars, aes(x = wt, y = mpg)) + geom_point() + annotate("text", x = 4, y = 25, label = "This should be bold\nand this not", …
Konrad
  • 17,740
  • 16
  • 106
  • 167
42
votes
7 answers

Chart.js number format

I went over the Chart.js documentation and did not find anything on number formatting ie) 1,000.02 from number format "#,###.00" I also did some basic tests and it seems charts do not accept non-numeric text for its values Has anyone found a way to…
Ronald
  • 611
  • 1
  • 5
  • 12
41
votes
5 answers

How can I remove the white border from Chart.js pie chart?

I am using Chart.js pie chart and I'd like to remove white lines between slices. Could someone tell me way to do this ? Thanks in advance I didn't see anything in the documenation.
Ris
  • 1,892
  • 9
  • 26
  • 43
41
votes
3 answers

Best way to draw a bar chart in LaTeX?

I was looking for it here in Stack Overflow as in Google, and I found a lot of packages to draw, but it seems a complex task, so I would like to know which is the most appropriate package to draw bars, and associate data to it. Also I was looking…
Tae
  • 1,665
  • 5
  • 24
  • 45
41
votes
4 answers

How to add labels into Chart.js canvas plugin?

I'm using the awesome plugin Chart.js, and I'm trying to find the way of display labels within each percentage. So I googled it, and I found this pull: https://github.com/nnnick/Chart.js/pull/35 I did a simple fiddle to test it, but doesn't works:…
mllamazares
  • 7,876
  • 17
  • 61
  • 89
40
votes
22 answers

Nice Label Algorithm for Charts with minimum ticks

I need to calculate the Ticklabels and the Tickrange for charts manually. I know the "standard" algorithm for nice ticks (see http://books.google.de/books?id=fvA7zLEFWZgC&pg=PA61&lpg=PA61&redir_esc=y#v=onepage&q&f=false) and I also know this Java…
Dominik Obermaier
  • 5,610
  • 4
  • 34
  • 45