I was looking for it here in Stack Overflow as in Google, and I found a lot of packages to draw, but it seems a complex task, so I would like to know which is the most appropriate package to draw bars, and associate data to it. Also I was looking for a code example, but I did not have luck.
Asked
Active
Viewed 8.7k times
3 Answers
50
Package: bchart
Example code:
\documentclass[varwidth=true, border=2pt]{standalone}

\usepackage{bchart}

\begin{document}
    \begin{bchart}[step=2,max=10]
        \bcbar{3.4}
            \smallskip
        \bcbar{5.6}
            \medskip
        \bcbar{7.2}
            \bigskip
        \bcbar{9.9}
    \end{bchart}
\end{document}
Result:
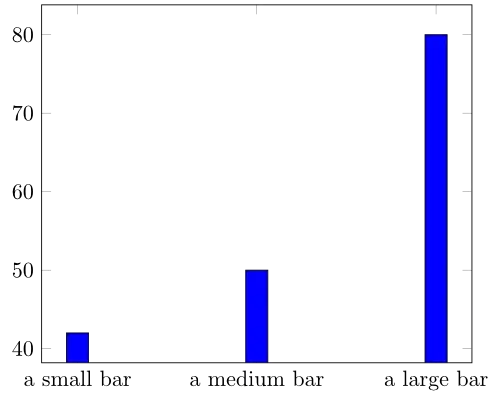
Package: pgfplots
- Manual: Page 81 - 89
Example code:
% Source: https://tex.stackexchange.com/a/8584/5645
\documentclass[varwidth=true, border=2pt]{standalone}

\usepackage{pgfplots}

\begin{document}
    \begin{tikzpicture}
        \begin{axis}[
            symbolic x coords={a small bar, a medium bar, a large bar},
            xtick=data
          ]
            \addplot[ybar,fill=blue] coordinates {
                (a small bar,   42)
                (a medium bar,  50)
                (a large bar,   80)
            };
        \end{axis}
    \end{tikzpicture}
\end{document}
Result:
I plan to add some more examples to my GitHub repository. You might also be interested in tex.stackexchange.com tag:bar-chart.
Aya
- 73
- 1
- 4
Martin Thoma
- 124,992
- 159
- 614
- 958
-
I tried both options. This sample codes compile but when I produce a PDF I see a blank page with a few digits on it - no bar chart. Shouldn't dvipdfm be able to parse the compiled dvi file from these two samples? – zvisofer May 13 '15 at 15:52
-
30
That sounds like an easy job for the pgfplots package. Section 4.5 from the manual contains a lot of examples to start from, everything is explained from scratch and step-by-step. If you need more pgfplots examples, the section dedicated to plots at TeXample could be of interest. There aren't any bar plots, but it contains some nice (and more elaborate) examples of the functionality.
As for a code example, I could copy-and-paste one from the manual, but that would not add much to this post I believe.
Edit: when using Matlab, it is possible to use matlab2tikz. This way you can export your plots without having to worry about the actual code. Bar charts should be possible, but I haven't used that functionality yet so I don't know about any quirks. The plots I did export using this Matlab script were perfect and you get the consistency and flexibility you want :).
7
This might be viewed as sacrilege, but it's actually not that terrible to generate the plot using matlab, excel or any other tool, and merely include the PDF/jpg in. pgfplots is a more elegant option, but might not be the quickest.
Suresh
- 602
- 5
- 13
-
5And lose the consistency, while `pgfplots` is such a good and not too difficult package? That would be a shame, don't you think? :) As per your suggestion of Matlab, I'll edit my post. – Pieter Jun 05 '10 at 06:08
-
-
Using knitr with a tikz device will be completely consistent not only with LaTeX fonts, but also with primary source data if they changed. Moreover, you do not have to work with external tool like Excel, all the R and Latex code could be in the same file. – Fran Feb 05 '19 at 02:04