Questions tagged [charts]

Charts are a graphical representation of data, most often in the format of a graph or diagram. Use this tag for questions about using a charting library API.

Charts are a graphical representation of data, using dots, lines, bars, geometric figures or other graphical elements. They can help you visualize vast amounts of data in a way that is easily understood. Similar to the saying "A picture is worth more than 1000 words", one may say "A chart is worth more than 1000 reports" ...

There are many different versions (types) of charts. Here are just a few examples of them:
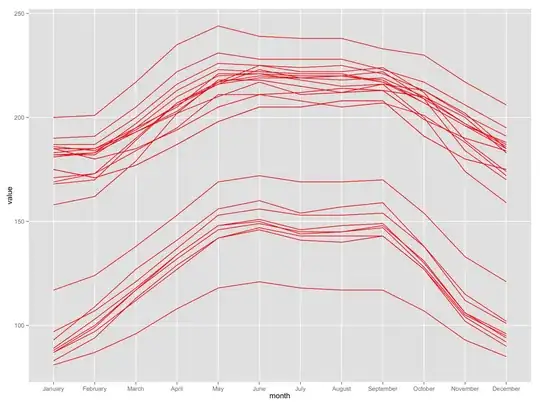
Pie Chart Bar Chart Combined Chart Funnel Chart


Related tags

26456 questions
5
votes
1 answer

Is it possible to revert x-axe values in line chart with chart.js

I am using chart.js and i have line chart with values from 10 to 100. My top point have value 100, but that is incorrect for my data. For me 100 is the bad result. Is there a way to revert x-axe to start from 100 to 10. If its not possible, can…
Petroff
  • 808
  • 1
  • 12
  • 30
5
votes
2 answers

Graphing or charting in windows mobile 6

Do you know of a [free] library for graphing or charting, similar to Zedgraph, but that works for developing on windows mobile 6?
5
votes
1 answer

Set Range for axis with google image charts

I am trying to change the range of graph using chxr. My code is
Penny
  • 824
  • 1
  • 14
  • 31
5
votes
2 answers

Free chart library for creating lines, bar (stacked & grouped) and combined in Android

I have an application in which I need to create below types of charts: Lines Bar/Column (grouped and stacked) Combined (lines and bar) In addition, it will be good to have below features if possible: Support Package constantly updated (not…
Willy
  • 9,848
  • 22
  • 141
  • 284
5
votes
1 answer

AngularJS google Chart : ChartRangeFilter

I am using AngularJS Google Chart to display a line chart. I was reading about ChartRangeFilter and need to use it in my graph. Is it possible to integrate the range filter from within AngularJs Google Chart? or it doesn't have this feature…
ccot
  • 1,875
  • 3
  • 36
  • 54
5
votes
1 answer

Bokeh - get information about points that have been selected

I have a several points that I plot into scatter plot and show in web browser window (using Bokeh). For selection, I use PolySelectTool or BoxSelectTool. There are two things I would like to do: 1) Get information about points that have been…
Marek
  • 815
  • 8
  • 19
5
votes
1 answer

Hide some graphic elements, c3js, without unloading data

Is it possible to hide certain lines, bars and other graphic elements from a c3js chart, without unloading or hiding data? I wish to keep that data in the tooltip but hide some graphic elements. Hover over one bar and see data for other hidden bars.…
JasTonAChair
  • 1,948
  • 1
  • 19
  • 31
5
votes
1 answer

Improve labeling on pie chart in subplot

I'm plotting a figure with three subplots: fig = plt.figure(fignum) ax11 = plt.subplot2grid((2,2), (0,0)) ax12 = plt.subplot2grid((2,2), (0,1)) ax13 = plt.subplot2grid((2,2), (1,0), colspan=2) ax13.axis('off') I'm using Pandas for my data and I…
Alaa Ali
  • 896
  • 1
  • 12
  • 24
5
votes
4 answers

how can i remove x-axis title in google bar chart?

i tried to create a bar chart using google chart api. in which i want to remove the x-axis title