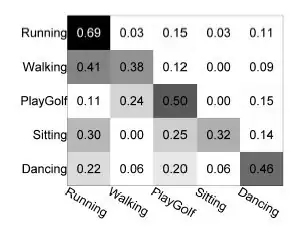
I want to create images like this from a double precision matrix using MATLAB.
Sample image:
I want to create images like this from a double precision matrix using MATLAB.
Sample image:
You can create this sort of plot yourself pretty easily using the built-in functions imagesc and text and adjusting a number of parameters for the graphics objects. Here's an example:
mat = rand(5); % A 5-by-5 matrix of random values from 0 to 1
imagesc(mat); % Create a colored plot of the matrix values
colormap(flipud(gray)); % Change the colormap to gray (so higher values are
% black and lower values are white)
textStrings = num2str(mat(:), '%0.2f'); % Create strings from the matrix values
textStrings = strtrim(cellstr(textStrings)); % Remove any space padding
[x, y] = meshgrid(1:5); % Create x and y coordinates for the strings
hStrings = text(x(:), y(:), textStrings(:), ... % Plot the strings
'HorizontalAlignment', 'center');
midValue = mean(get(gca, 'CLim')); % Get the middle value of the color range
textColors = repmat(mat(:) > midValue, 1, 3); % Choose white or black for the
% text color of the strings so
% they can be easily seen over
% the background color
set(hStrings, {'Color'}, num2cell(textColors, 2)); % Change the text colors
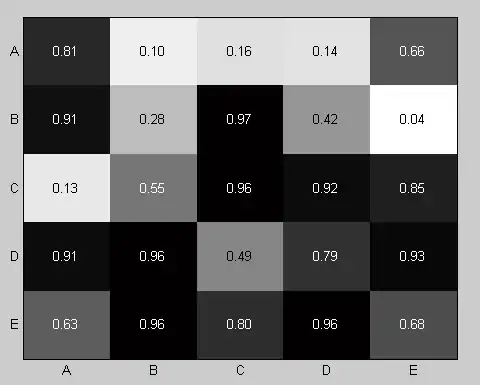
set(gca, 'XTick', 1:5, ... % Change the axes tick marks
'XTickLabel', {'A', 'B', 'C', 'D', 'E'}, ... % and tick labels
'YTick', 1:5, ...
'YTickLabel', {'A', 'B', 'C', 'D', 'E'}, ...
'TickLength', [0 0]);
And here's the figure this generates:
If you run into trouble with the x-axis tick labels you choose being too wide and overlapping one another, here's how you can handle it:
Newer versions of MATLAB: Not sure which version this was added, but in newer versions axes objects now have the properties '{X|Y|Z}TickLabelRotation', which allow you to rotate the labels and fit them better.
Older versions of MATLAB: For older versions you can find some submissions on the MathWorks File Exchange that can rotate the tick label text, like XTICKLABEL_ROTATE from Brian Katz.
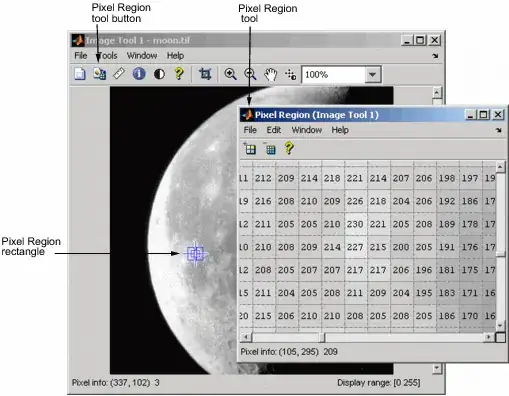
h = imagesc(magic(8))
impixelregion(h)
http://www.mathworks.com/help/toolbox/images/ref/impixelregion.html
Requires Image Processing Toolbox
I expect you could persuade Matlab to draw that, if you look at the File Exchange you may find someone has already written the code. But it would be a lot easier, if you don't have the code, to use MS Excel.
EDIT: So I gave this some more thought and here's what I came up with. I've not mastered posting graphics to SO, so trust me, this will lead you towards a solution. But it would honestly be easier with Excel.
First define a matrix with your data values; I call the matrix G in the following. Then execute the commands:
image(G);
colormap(gray)
Now, I had to do some fiddling around, rescaling the data, to get a good graphic, but this should produce a gray-scale plot with numeric axes. Now, go to your figure window and open the plot tools.
Select the X axis and hit the Ticks button. All you have to do now is edit the labels to the texts that you want. Do the same for the Y axis. Write the numbers in the squares on the plot -- use the Text Box from the Annotations menu.
After a lot of fiddling about you'll have the graphic you want. At this point, I suggest that you choose the menu command File | Generate M-File and do just that. If you want to create such graphics programmatically in future just turn the generated M file into a proper function that does what you want.
But it's still a lot easier in Excel.