6

Possible Duplicate:
How do I visualize a matrix with colors and values displayed?

I basically have a NxN (edit:N can be up to 80) matrix of double in MATLAB and I when to plot it as an array (I want to see the numbers) and some of the cells should be colored (the function to decide how I color my numbers is independent from the numbers).

I have thought of different ways to do that :

  • create an grid as an image and overlay it with the text but the plot of MATLAB is going to be horrible as it will remove some pixels to resize the image (my matrix can be around 80x80).

  • Export to excel ? Don't know how I would color the cells though.

Any help ?

As an image is sometimes more helpful :

enter image description here

Community
  • 1
  • 1
JohnCastle
  • 569
  • 1
  • 5
  • 11
  • N can be equal to 100 (maximum). That is why this solution http://stackoverflow.com/questions/3942892/how-do-i-visualize-a-matrix-with-colors-and-values-displayed doesn't apply. I think I am going to write text into the image using http://www.mathworks.com/support/solutions/en/data/1-1BALJ/?solution=1-1BALJ and then save the image – JohnCastle Aug 16 '11 at 12:59
  • It is not an "exact duplicate" (my problem was dealing with the a high size of cells, not actually producing the output) at all but if you say so... – JohnCastle Aug 18 '11 at 15:34

4 Answers4

8

Consider the following code:

%# matrix
M = rand(11,11);
[r c] = size(M);

%# text location and labels
[xloc yloc] = meshgrid(1:c,1:r);
xloc = xloc(:); yloc = yloc(:);
str = strtrim(cellstr( num2str(M(:),'%.3g') ));
xticklabels = cellstr( num2str((1:c)','M%d') );
yticklabels = cellstr( num2str((1:r)','M%d') );

%# plot colored cells
mask = M>0.9;               %# or any other mask
h = imagesc(1:c, 1:r, ones(size(M)));
set(h, 'AlphaData',mask)
colormap(summer)            %# colormap([0 1 0])
set(gca, 'Box','on', 'XAxisLocation','top', 'YDir','reverse', ...
    'XLim',[0 c]+0.5, 'YLim',[0 r]+0.5, 'TickLength',[0 0], ...
    'XTick',1:c, 'YTick',1:r, ...
    'XTickLabel',xticklabels, 'YTickLabel',yticklabels, ...
    'LineWidth',2, 'Color','none', ...
    'FontWeight','bold', 'FontSize',8, 'DataAspectRatio',[1 1 1]);

%# plot grid
xv1 = repmat((2:c)-0.5, [2 1]); xv1(end+1,:) = NaN;
xv2 = repmat([0.5;c+0.5;NaN], [1 r-1]);
yv1 = repmat([0.5;r+0.5;NaN], [1 c-1]);
yv2 = repmat((2:r)-0.5, [2 1]); yv2(end+1,:) = NaN;
line([xv1(:);xv2(:)], [yv1(:);yv2(:)], 'Color','k', 'HandleVisibility','off')

%# plot text
text(xloc, yloc, str, 'FontSize',8, 'HorizontalAlignment','center');

screenshot

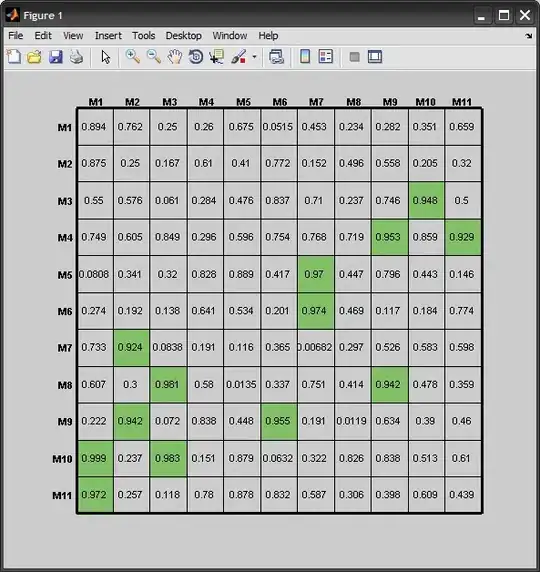
As you increase the size of the matrix, the text will eventually overlap...


EDIT

Here is a way that works with larger matrices: we use an invisible figure, resize it to something big enough, and use a small font size (I used 2):

M = rand(80,80);

figure('visible','off')
set(gcf, 'Units','Pixels', 'Position', [0, 0, 10000, 10000], ...
     'PaperPositionMode','Auto');
set(gca, 'units','normalized', 'position',[0.05 0.02 0.9 0.95])

%# ... 

Then at the end, export to file with a high resolution:

%# ...

print -dpng -r600 file.png

You can see the output file here (10025x5962 image, 645KB)

Amro
  • 123,847
  • 25
  • 243
  • 454
  • When N gets too big (N=30 for instance), we can't see anything which doesn't suit me. – JohnCastle Aug 16 '11 at 16:59
  • @JohnCastle: IMO you have to rethink your visualization, as you can't possibly draw that much text and still expect it to be clearly visible (we obviously have a limited number of pixels on the screen).. – Amro Aug 16 '11 at 17:09
  • I manage to do a function that suits me now, I create an image that I generate with matlab but I see it through the windows visualiser and I can zoom in or zoom out to see what I want. – JohnCastle Aug 16 '11 at 17:13
  • @JohnCastle: you should share your code then, as it may help future readers... Anyway see my recent edit for solution to your problem (I tried it with `N=80`) – Amro Aug 16 '11 at 18:59
  • Great, I didn't know you could change the resolution of the file. My solution was to create a small image for each cell with text inside, print it and put the result in a big array representing the final image and then imwrite the image. It was too long though. Thanks again :) – JohnCastle Aug 18 '11 at 15:33
1

If you are willing to output to html (typically using matlab's publish ability), you can modify one of many html table functions on the file exchange to suit your needs. Here is one example. This will enable you to output text as well as colors.

Rich C
  • 3,164
  • 6
  • 26
  • 37
  • Thanks, nice idea. It is too late now nevertheless, I already did my function... Basically, my main problem what that I couldn't use matlab print because my matrix was too big, so I used the function print on small parts of my image and put everything back in the image. It is a bit slow though. – JohnCastle Aug 16 '11 at 16:08
0

http://www.mathworks.com/products/matlab/demos.html?file=/products/demos/shipping/matlab/imagedemo.html ?

Then you can try to write text on it

ixM
  • 1,244
  • 14
  • 29
  • Thank you but it doesn't solve my problem : my colors are independent from my values in my matrix. I just want to plot my text above it. But the problem is that matlab resize the matlab and I lose some pixels and it doesn't look good at all if I do what you say. – JohnCastle Aug 16 '11 at 11:13
0

In Excel you can always use conditional formatting, no problems there.

As far as matlab goes, I've never done something like it (although the idea has crossed my mind). Did you have in mind something like this How do I visualize a matrix with colors and values displayed?

Community
  • 1
  • 1
Rook
  • 60,248
  • 49
  • 165
  • 242
  • Yep but as my matrix can get big, the plot in matlab is going to look quite bad... What I canmaybe do is have the text inside the image as pixels and not as a text object and save the image instead of plotting it. Any idea how to do that ? – JohnCastle Aug 16 '11 at 11:16
  • @johnCastle - Sorry, no. I don't use matlab - this I just found in a quick search, cause it seemed like a good idea. – Rook Aug 16 '11 at 13:30