4

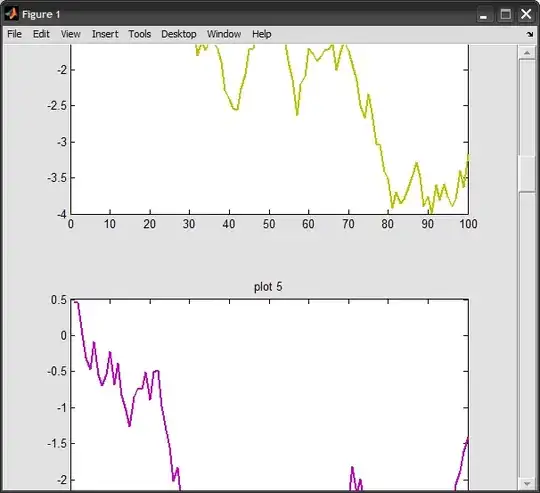
How can I add scrollbar to the subplots?

I have gone through many tutorials but they seem quite difficult to understand (ex: Scrolling Figure Demo)

Any easier method to implement?


My code looks like the following. It creates two figures ,one for multiple plots and one for subplots. For the case of subplots i wanted to have scroll bar so as i can slide it down. I dont know how to call this function, if i replace the call of addaxis to my function then how would the axis be readjusted without any call to addaxis function.

function readfile
while(1)

q = cell(16,2);
q{1,1}='1B000003AC63A328.txt'; % sensor 1
q{1,2} = 'sensor 1';
q{2,1}='D6000003ACA0AB28.txt';% sensor 2
q{2,2} = 'sensor 2'; 
q{3,1}='B0000003AC9B8428.txt'; % sensor 3
q{3,2} = 'sensor 3'; 
q{4,1}='5D000003AC5FEA28.txt';% sensor 4
q{4,2} = 'sensor 4'; 
q{5,1}='E1000003AC5DA728.txt';% sensor 5
q{5,2} = 'sensor 5'; 
q{6,1}='BE000003ACA4F828.txt';% sensor 6
q{6,2} = 'sensor 6';
q{7,1}='5F000003AC8C6128.txt';% sensor 7
q{7,2} = 'sensor 7'; 
q{8,1}='78000003AC77A328.txt';
q{8,2} = 'sensor 8'; % sensor 8
q{9,1}='B2000003AC542A28.txt';% sensor 9
q{9,2} = 'sensor 9'; 
q{10,1}='EB000003B717F328.txt';% sensor 10
q{10,2} = 'sensor 10';
q{11,1}='86000003AC97AC28.txt';% sensor 11
q{11,2} = 'sensor 11'; 
q{12,1}='78000003AC748828.txt';% sensor 12
q{12,2} = 'sensor 12'; 
q{13,1}='A5000003AC905C28.txt';% sensor 20
q{13,2} = 'sensor 20'; 
q{14,1}='B4000003ACA4A728.txt';% sensor 21
q{14,2} = 'sensor 21'; 
q{15,1}='14000003AC69A528.txt';% sensor 22
q{15,2} = 'sensor 22'; 
q{16,1}='99000003AC68F728.txt';% sensor 23
q{16,2} = 'sensor 23';

for j=1:16
fname=q{j};
fid=fopen(fname,'r');
header=fgetl(fid);
data=textscan(fid,'%s','delimiter',';');
fclose(fid);
data=data{:};
day=data(1:3:end);
hour=data(2:3:end);
temp=str2double(data(3:3:end));
time=cellfun(@(x) sprintf('%s %s',day{strcmpi(hour,x)},x),hour,'uniformoutput',0);
% timev=datevec(time,'mm.dd.yyyy HH:MM:SS');
timen=datenum(time,'mm.dd.yyyy HH:MM:SS');
seconds=timen*86400/60;
figure(1)
subplot(5,4,j),

h=plot(seconds-seconds(1),temp,'YDataSource','temp');
legend(h,q{j,2});

grid on
xlabel('Time(mins)');
ylabel('Temp °C');

%subplot(1,1,i),
figure(2)
if(j==1)
r=plot(seconds-seconds(1),temp);
hold on
set(r,'Color','blue','LineWidth',2)
end
if(j==2)
    r=plot(seconds-seconds(1),temp);

    set(r,'Color','green','LineWidth',2)
end
if(j==3)
    r=plot(seconds-seconds(1),temp);

    set(r,'Color','red','LineWidth',2)

end
if(j==4)
    r=plot(seconds-seconds(1),temp);

    set(r,'Color','cyan','LineWidth',2)

end

if(j==5)
     r=plot(seconds-seconds(1),temp);

    set(r,'Color','magenta','LineWidth',2)

end
if(j==6)
     r=plot(seconds-seconds(1),temp);

    set(r,'Color','yellow','LineWidth',2)

end
   if(j==7)
     r=plot(seconds-seconds(1),temp);

    set(r,'Color','black','LineWidth',2)

   end
   if(j==8)
     r=plot(seconds-seconds(1),temp,'--');

    set(r,'Color','blue','LineWidth',2)

   end
   if(j==9)
     r=plot(seconds-seconds(1),temp,'--');

     set(r,'color','green','LineWidth',2)

   end
   if(j==10)
     r=plot(seconds-seconds(1),temp,'--');

    set(r,'Color','red','LineWidth',2)

   end
   if(j==11)
     r=plot(seconds-seconds(1),temp,'--');
    set(r,'Color','cyan','LineWidth',2)

   end
   if(j==12)
     r=plot(seconds-seconds(1),temp,'--');
     hold on
    set(r,'Color','magenta','LineWidth',2)

   end
   if(j==13)
     r=plot(seconds-seconds(1),temp,'--');

    set(r,'Color','yellow','LineWidth',2)

   end
   if(j==14)
     r=plot(seconds-seconds(1),temp,'--');

    set(r,'Color','black','LineWidth',2)

   end
   if(j==15)
     r=plot(seconds-seconds(1),temp,'-.');

    set(r,'Color','blue','LineWidth',2)

   end
   if(j==16)
     r=plot(seconds-seconds(1),temp,'-.');
    set(r,'Color','green','LineWidth',2)


   end

legend('Sensor 1','Sensor 2','Sensor 3','Sensor 4','Sensor 5','Sensor 6',...
   'Sensor 7','Sensor 8','Sensor 9','Sensor 10','Sensor 11','Sensor 12','Sensor 20','Sensor 21','Sensor 22','Sensor 23','Location','BestOutside')


end
pause(2*60)
end end
Robert Harvey
  • 178,213
  • 47
  • 333
  • 501
mirage
  • 145
  • 2
  • 8
  • 19
  • similar question: [add scrollbar to figure with subplots](http://stackoverflow.com/questions/5122716/add-scrollbar-to-figure-with-subplots) – Amro Oct 02 '11 at 00:42

1 Answers1

13

I'm not sure what demo you are referring to, but let me explain how I would implement such a functionality.

The idea is to create a large panel inside a figure, which will contain all the subplots. The panel would be larger than the figure in size. You will have to manually position the axes inside this panel. Also using a slider, you will have to maintain the position of the panel itself to control which part of it is visible.

Consider the following example. We will create a figure such that we scroll vertically to see all the subplots.

We start by creating a figure, and placing a panel and a slider components to fill the entire figure:

%# create figure, panel, and slider
w = 600; h = 500;           %# width/height of figure
handles.hFig = figure('Menubar','figure', 'Resize','off', ...
    'Units','pixels', 'Position',[200 200 w h]);
handles.hPan = uipanel('Parent',handles.hFig, ...
    'Units','pixels', 'Position',[0 0 w-20 h]);
handles.hSld = uicontrol('Parent',handles.hFig, ...
    'Style','slider', 'Enable','off', ...
    'Units','pixels', 'Position',[w-20 0 20 h], ...
    'Min',0-eps, 'Max',0, 'Value',0, ...
    'Callback',{@onSlide,handles.hPan});

For now the slider is disabled. Note that in order to keep things simple, I turned off figure resizing. That way we can position components in fixed pixel units.

Next, we will create new axes one at a time, making each fill one view page. I placed that code inside a separate function addAxis for easy use. First let me show how we call this function:

%# add and plot to axes one-by-one
hAx = zeros(7,1);
clr = lines(7);
for i=1:7
    hAx(i) = addAxis(handles);
    plot(hAx(i), cumsum(rand(100,1)-0.5), 'LineWidth',2, 'Color',clr(i,:))
    title(hAx(i), sprintf('plot %d',i))
    pause(1)   %# slow down so that we can see the updates
end

The addAxis simply grows the container panel in size, creates an axis, position it on the top, adjusts the slider limits, then returns a handle to the newly created axis.

function hAx = addAxis(handles)
    %# look for previous axes
    ax = findobj(handles.hPan, 'type','axes');

    if isempty(ax)
        %# create first axis
        hAx = axes('Parent',handles.hPan, ...
            'Units','normalized', 'Position',[0.13 0.11 0.775 0.815]);
        set(hAx, 'Units','pixels');

    else
        %# get height of figure
        p = get(handles.hFig, 'Position');
        h = p(4);

        %# increase panel height, and shift it to show new space
        p = get(handles.hPan, 'Position');
        set(handles.hPan, 'Position',[p(1) p(2)-h p(3) p(4)+h])

        %# compute position of new axis: append on top (y-shifted)
        p = get(ax, 'Position');
        if iscell(p), p = cell2mat(p); end
        p = [p(1,1) max(p(:,2))+h p(1,3) p(1,4)];

        %# create the new axis
        hAx = axes('Parent',handles.hPan, ...
            'Units','pixels', 'Position',p);

        %# adjust slider, and call its callback function
        mx = get(handles.hSld, 'Max');
        set(handles.hSld, 'Max',mx+h, 'Min',0, 'Enable','on')
        %#set(handles.hSld, 'Value',mx+h)       %# scroll to new space
        hgfeval(get(handles.hSld,'Callback'), handles.hSld, []);
    end

    %# force GUI update
    drawnow
end

The slider callback function simply shifts the panel up and down according to the current value of the slider:

function onSlide(hSld,ev,hPan)
    %# slider value
    offset = get(hSld,'Value');

    %# update panel position
    p = get(hPan, 'Position');  %# panel current position
    set(hPan, 'Position',[p(1) -offset p(3) p(4)])
end

The result of this example:

screenshot

Amro
  • 123,847
  • 25
  • 243
  • 454
  • wonderful...that really solved my problem..im looking into this code so as I can modify in my accordance I have to plot the data from different text files so I looped them under for loop. i used the subplot command as i had no space before but now as by adding scroll bar another for loop is added in hax plot command. by adding all this my code only plots(just legend) the first graph and then the axis are rather haphazard and no graph is displayed. I intended to scale automatically and dont want to limit xmin and xmax – mirage Oct 04 '11 at 00:09
  • @Khalid: I don't know what existing code you have, but I think, after using this code, all you have to do is replace the calls to `subplot` by calls to the above function `addAxis` (with the correct arguments of course) – Amro Oct 04 '11 at 00:31
  • It creates two figures ,one for multiple plots and one for subplots. For the case of subplots i wanted to have scroll bar so as i can slide it down. I dont know how to call this function, if i replace the call of addaxis to my function then how would the axis be readjusted without any call to addaxis function. thats how my function looks like function abc subplot(5,4,j), h=plot(seconds-seconds(1),temp,'YDataSource','temp'); legend(h,q{j,2}); figure(2) r=plot(seconds-seconds(1),temp); % multiple plots on same figure hold on – mirage Oct 05 '11 at 19:06
  • Hello! I've tried this solution and it's wonderful, but I have a problem with the position of the scroll bar, I mean, the original position with this code is in the bottom of the bar, but I need it in the top, I hope you can help me, thanks by the way! – lisandrojim Sep 16 '14 at 19:28
  • I found the answer, it is just: set(handles.hSld,'Value',get(handles.hSld,'Max')) – lisandrojim Sep 16 '14 at 19:46