212

Every time I make a plot using ggplot, I spend a little while trying different values for hjust and vjust in a line like

+ opts(axis.text.x = theme_text(hjust = 0.5))

to get the axis labels to line up where the axis labels almost touch the axis, and are flush against it (justified to the axis, so to speak). However, I don't really understand what's going on. Often, hjust = 0.5 gives such dramatically different results from hjust = 0.6, for example, that I haven't been able to figure it out just by playing around with different values.

Can anyone point me to a comprehensive explanation of how hjust and vjust options work?

Gavin Simpson
  • 170,508
  • 25
  • 396
  • 453
William Gunn
  • 2,925
  • 8
  • 26
  • 22
  • 1
    I did give a specific example, in the comments to the first answer. Apparently using numbers outside of 0-1 is undefined, which, if not explaining why hjust=-1 has bizarre behavior, at least explains that bizarre is to be expected. – William Gunn Sep 01 '11 at 19:04

2 Answers2

367

The value of hjust and vjust are only defined between 0 and 1:

  • 0 means left-justified
  • 1 means right-justified

Source: ggplot2, Hadley Wickham, page 196

(Yes, I know that in most cases you can use it beyond this range, but don't expect it to behave in any specific way. This is outside spec.)

hjust controls horizontal justification and vjust controls vertical justification.

An example should make this clear:

td <- expand.grid(
    hjust=c(0, 0.5, 1),
    vjust=c(0, 0.5, 1),
    angle=c(0, 45, 90),
    text="text"
)

ggplot(td, aes(x=hjust, y=vjust)) + 
    geom_point() +
    geom_text(aes(label=text, angle=angle, hjust=hjust, vjust=vjust)) + 
    facet_grid(~angle) +
    scale_x_continuous(breaks=c(0, 0.5, 1), expand=c(0, 0.2)) +
    scale_y_continuous(breaks=c(0, 0.5, 1), expand=c(0, 0.2))

enter image description here


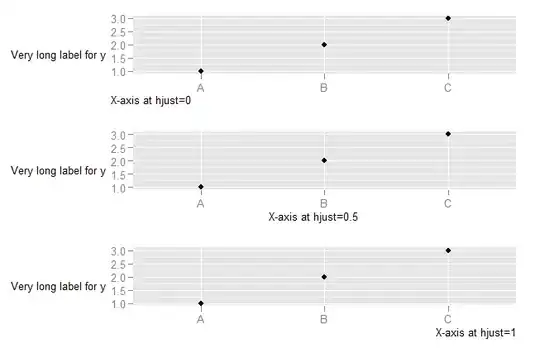
To understand what happens when you change the hjust in axis text, you need to understand that the horizontal alignment for axis text is defined in relation not to the x-axis, but to the entire plot (where this includes the y-axis text). (This is, in my view, unfortunate. It would be much more useful to have the alignment relative to the axis.)

DF <- data.frame(x=LETTERS[1:3],y=1:3)
p <- ggplot(DF, aes(x,y)) + geom_point() + 
    ylab("Very long label for y") +
    theme(axis.title.y=element_text(angle=0))


p1 <- p + theme(axis.title.x=element_text(hjust=0)) + xlab("X-axis at hjust=0")
p2 <- p + theme(axis.title.x=element_text(hjust=0.5)) + xlab("X-axis at hjust=0.5")
p3 <- p + theme(axis.title.x=element_text(hjust=1)) + xlab("X-axis at hjust=1")

library(ggExtra)
align.plots(p1, p2, p3)
enter image description here


To explore what happens with vjust aligment of axis labels:

DF <- data.frame(x=c("a\na","b","cdefghijk","l"),y=1:4)
p <- ggplot(DF, aes(x,y)) + geom_point()

p1 <- p + theme(axis.text.x=element_text(vjust=0, colour="red")) + 
        xlab("X-axis labels aligned with vjust=0")
p2 <- p + theme(axis.text.x=element_text(vjust=0.5, colour="red")) + 
        xlab("X-axis labels aligned with vjust=0.5")
p3 <- p + theme(axis.text.x=element_text(vjust=1, colour="red")) + 
        xlab("X-axis labels aligned with vjust=1")


library(ggExtra)
align.plots(p1, p2, p3)
enter image description here

Droplet
  • 935
  • 9
  • 12
Andrie
  • 176,377
  • 47
  • 447
  • 496
  • 1
    So for the case of angle=45, when I have axis labels of varying length, let's say from 25 to 5 characters, they're neither aligned justified to the right or the left of the word boundaries. Take a look at the axes [here](http://db.tt/kl2NcV7) If I were to use angle=45, how would I make them right-justified and flush against the axis? – William Gunn Sep 01 '11 at 19:11
  • I have tried that, and I get `Error in grid.Call("L_textBounds", as.graphicsAnnot(x$label), x$x, x$y, : Polygon edge not found (zero-width or zero-height?)` for `vjust = .72` and higher. – William Gunn Sep 03 '11 at 00:48
  • 1
    @WilliamGunn I suggest you post a new question with your code. – Andrie Sep 03 '11 at 07:26
  • I will, I was hoping here to get not just a fix for my specific problem, but an understanding of how the system worked in general, which I only half-did. – William Gunn Sep 07 '11 at 01:09
  • 1
    since opt is deprecated, how do we adjust position of axis title? – Cyrus Mohammadian Sep 19 '16 at 03:31
  • Warning googlers - @Andrie's very helpful explanation only works for ggplot version 1 not 2.2. See hadley https://github.com/hadley/ggplot2/issues/1435 notes "This means hacks with vjust and hjust no longer work". They now have a `margin` parameter but it has some tweaks needed still – micstr Oct 03 '16 at 11:01
  • I just wanted to say that the first chart is an excellent and informative visualization. Thanks! – Adam_G May 12 '17 at 16:10
  • that's not defined only between 0 and 1, at least in some cases, I think that positive value means to adjust to the left (hadjust) or up (vadjust), and negative value means to adjust to the right or down, the absolute value means the magnitude of the adjustment, i.e. by how much you want to adjust. – Jia Gao Jan 28 '18 at 01:58
  • 1
    @CyrusMohammadian, I have edited this answer to work with the current ggplot2 syntax. – Droplet Jul 24 '19 at 11:21
  • Regarding your comment on aligning titles relatively to the axes: this is now solved at [Perfectly aligning axis titles to axis edges](https://stackoverflow.com/questions/65371356/perfectly-aligning-axis-titles-to-axis-edges/65371357#65371357) – Christian Dec 19 '20 at 15:25
  • Small nuance: you can expect `hjust`/`vjust` to behave in a certain way (even though it is out of spec, it is not undefined). Relative to the text's anchorpoint, `hjust` moves text along the direction of the text, in text-width units. Likewise, `vjust` moves text orthogonal to the direction of the text, in text-height units. Of course these units differ per font and their size, so are a bit unpredictable in that `hjust` for a narrow font moves the text less in absolute units than it does for a broad font. – teunbrand Mar 30 '22 at 19:05
21

Probably the most definitive is Figure B.1(d) of the first edition of the ggplot2 book.

Image capture of Figure B.1 from page 197 of the first edition of "ggplot2: Elegant Graphics for Data Analysis"

Note: the third edition of the book available at https://ggplot2-book.org/ does not appear to have these appendices nor this figure.

However, it is not quite that simple. hjust and vjust as described there are how it works in geom_text and theme_text (sometimes). One way to think of it is to think of a box around the text, and where the reference point is in relation to that box, in units relative to the size of the box (and thus different for texts of different size). An hjust of 0.5 and a vjust of 0.5 center the box on the reference point. Reducing hjust moves the box right by an amount of the box width times 0.5-hjust. Thus when hjust=0, the left edge of the box is at the reference point. Increasing hjust moves the box left by an amount of the box width times hjust-0.5. When hjust=1, the box is moved half a box width left from centered, which puts the right edge on the reference point. If hjust=2, the right edge of the box is a box width left of the reference point (center is 2-0.5=1.5 box widths left of the reference point. For vertical, less is up and more is down. This is effectively what that Figure B.1(d) says, but it extrapolates beyond [0,1].

But, sometimes this doesn't work. For example

DF <- data.frame(x=c("a","b","cdefghijk","l"),y=1:4)
p <- ggplot(DF, aes(x,y)) + geom_point()

p + opts(axis.text.x=theme_text(vjust=0))
p + opts(axis.text.x=theme_text(vjust=1))
p + opts(axis.text.x=theme_text(vjust=2))

The three latter plots are identical. I don't know why that is. Also, if text is rotated, then it is more complicated. Consider

p + opts(axis.text.x=theme_text(hjust=0, angle=90))
p + opts(axis.text.x=theme_text(hjust=0.5 angle=90))
p + opts(axis.text.x=theme_text(hjust=1, angle=90))
p + opts(axis.text.x=theme_text(hjust=2, angle=90))

The first has the labels left justified (against the bottom), the second has them centered in some box so their centers line up, and the third has them right justified (so their right sides line up next to the axis). The last one, well, I can't explain in a coherent way. It has something to do with the size of the text, the size of the widest text, and I'm not sure what else.

Brian Diggs
  • 57,757
  • 13
  • 166
  • 188
  • Thanks a lot for this, this helps for the case where angle = 90, but what I don't get is why the right-justification of labels doesn't work anymore when instead of angle=90, I use angle=45. I understand the behavior of angle=45, hjust=0, but angle=45, hjust=-1 is just bizarre. – William Gunn Sep 01 '11 at 00:51
  • Your first example does, in fact, work. The reason you think it doesn't work is because all of your labels have the same height. Try it again with `DF <- data.frame(x=c("a\na","b","cdefghijk","l"),y=1:4)` - i.e. with a `\n` linebreak in one of the titles. – Andrie Sep 01 '11 at 07:57
  • @William, I think @Andrie has it right; `hjust` and `vjust` are only defined between 0 and 1; behavior outside that range need not make sense. – Brian Diggs Sep 01 '11 at 14:54
  • @Andrie, You are right. But I still have a hard time making a coherent mental model in the axis title/text case. For the axis text, `hjust=0` aligns the left edge with the tic; `hjust=0.5` centers on the tic; `hjust=1` aligns the right edge with the tic (moving box relative to reference point). But `vjust` aligns _within_ a box the size of the tallest label. – Brian Diggs Sep 01 '11 at 15:06
  • @BrianDiggs In the case of `vjust` of axis labels, all of the labels are simultaneously aligned with one another. So all of the top edges align when `vjust=1` and likewise all the bottom edges when `vjust=0`. This makes perfect sense to me. – Andrie Sep 01 '11 at 15:18
  • @Andrie It still doesn't make sense (seem consistent) to me: `vjust` aligns labels with respect to each other; `hjust` aligns labels with respect to the tick mark. The former aligns within a box whose size is determined by all the labels; the latter aligns this box with regard to a reference point (near the end of the tick). – Brian Diggs Sep 01 '11 at 16:04
  • 1
    @BrianDiggs I have added another plot at the bottom of my answer to demonstrate what happens with `vjust`. I am sorry, but I don't understand your comment. The bounding box remains in place - just the labels move inside the box. – Andrie Sep 01 '11 at 16:12