This is a straightforward question, however, I'm not sure if there is a simple way to do it in gnuplot. I thought I've seen a similar question earlier, but I can't find it.
At least, gnuplot has the option to set the aspect ratio of a graph, check help size. With this the graph will have the desired aspect ratio and eventually extra wide margins either on the left and right or on top and bottom, depending on the canvas aspect ratio.
The idea of this workaround is the following;
- set the aspect ratio of your graph to the desired ratio
GraphSizeFixedY/GraphSizeFixedX.
- set your canvas to the size
GraphSizeFixedX, GraphSizeFixedY, plot the graph and remember the margins (left, right, bottom, top)
- set your canvas to the "inverse" aspect ratio
GraphSizeFixedY, GraphSizeFixedX, replot and remember the margins
- set the canvas to the desired width and height and add the minimum of the remembered corresponding margins and replot again.
Drawback is that you have to plot 3 times.
I tried this for wxt and pdfcairo terminal. I hope it will also work for pdflatex terminal.
Maybe there is an easier solution which I haven`t thought of.
Code:
### fixed graph size and variable canvas size
reset session

myTerminal = 'wxt'
GraphSizeFixedX = 500
GraphSizeFixedY = 350
Unit = ''

# uncomment these lines if you want to use pdfcairo terminal
# myTerminal = 'pdfcairo'
# GraphSizeFixedX = 10
# GraphSizeFixedY = 7
# Unit = 'cm'

FILE = 'tbSizeGraphFixed.pdf'
set output FILE

set size ratio real(GraphSizeFixedY)/GraphSizeFixedX   # real() to avoid integer division

LMargin(n) = GPVAL_TERM_XMIN
RMargin(n) = GPVAL_TERM_XSIZE/GPVAL_TERM_SCALE+1-GPVAL_TERM_XMAX
BMargin(n) = GPVAL_TERM_YMIN
TMargin(n) = GPVAL_TERM_YSIZE/GPVAL_TERM_SCALE+1-GPVAL_TERM_YMAX

# set canvas ratio
set term @myTerminal size GraphSizeFixedX @Unit, GraphSizeFixedY @Unit

# actual plotting command
set xlabel "x-label"
set ylabel "y-label"
# set x2label "x2-label"    # uncomment for comparison
# set y2label "y2-label"    # uncomment for comparison
plot sin(x)

Lmargin1 = LMargin(0)
Rmargin1 = RMargin(0)
Bmargin1 = BMargin(0)
Tmargin1 = TMargin(0)

# set "inverse" canvas ratio
set term @myTerminal size GraphSizeFixedY @Unit, GraphSizeFixedX @Unit
replot
Lmargin2 = LMargin(0)
Rmargin2 = RMargin(0)
Bmargin2 = BMargin(0)
Tmargin2 = TMargin(0)

min(a,b) = a<b ? a : b
Factor = myTerminal eq "wxt" ? 1: GPVAL_TERM_SCALE    # not completely clear why this is needed

TermSizeVarX = GraphSizeFixedX + \
               real(min(Lmargin1,Lmargin2) + min(Rmargin1,Rmargin2)) / Factor
TermSizeVarY = GraphSizeFixedY + \
               real(min(Bmargin1,Bmargin2) + min(Tmargin1,Tmargin2)) / Factor

set term @myTerminal size TermSizeVarX @Unit, TermSizeVarY @Unit
set output FILE
replot

set output
### end of code
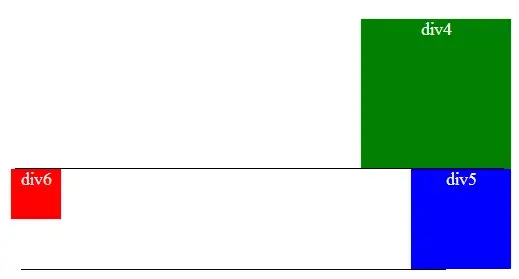
Result: (wxt terminal, graph size 500,350 pixels, background colored just for illustration)
x and y-label only. Canvas size 586 x 418 pixels

x,y,x2, and y2-label. Canvas size 610 x 434 pixels


