125

I have a simple data frame that I'm trying to do a combined line and point plot using ggplot2. Supposing my data looks like this:

df <- data.frame(x=rep(1:10,2), y=c(1:10,11:20), 
                 group=c(rep("a",10),rep("b",10)))

And I'm trying to make a plot:

g <- ggplot(df, aes(x=x, y=y, group=group))
g <- g + geom_line(aes(colour=group))
g <- g + geom_point(aes(colour=group, alpha = .8))
g

The result looks fine with one exception. It has an extra legend showing the alpha for my geom_point layer.

Extra Legend for <code>geom_point</code> transparency

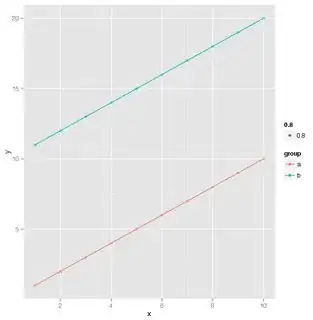
How can I keep the legend showing group colors, but not the one that shows my alpha settings?

theforestecologist
  • 4,667
  • 5
  • 54
  • 91
Wilduck
  • 13,822
  • 10
  • 58
  • 90

4 Answers4

225

Aesthetics can be set or mapped within a ggplot call.

  • An aesthetic defined within aes(...) is mapped from the data, and a legend created.
  • An aesthetic may also be set to a single value, by defining it outside aes().

In this case, it appears you wish to set alpha = 0.8 and map colour = group.

To do this,

Place the alpha = 0.8 outside the aes() definition.

g <- ggplot(df, aes(x = x, y = y, group = group))
g <- g + geom_line(aes(colour = group))
g <- g + geom_point(aes(colour = group), alpha = 0.8)
g

enter image description here

For any mapped variable you can supress the appearance of a legend by using guide = 'none' in the appropriate scale_... call. eg.

g2 <- ggplot(df, aes(x = x, y = y, group = group)) + 
        geom_line(aes(colour = group)) +
        geom_point(aes(colour = group, alpha = 0.8))
g2 + scale_alpha(guide = 'none')

Which will return an identical plot

EDIT @Joran's comment is spot-on, I've made my answer more comprehensive

mnel
  • 113,303
  • 27
  • 265
  • 254
  • 27
    This is the correct method, since the OP is setting rather than mapping an aesthetic, but in general you can suppress the appearance of any legend using something like `g + scale_alpha(guide = "none")`. – joran Jul 30 '12 at 03:15
  • Indeed. The answer has been elaborated upon. It does make more sense to have a comprehensive answer, not just specific to the OP issue. – mnel Jul 30 '12 at 03:32
  • 4
    Thanks so much for the added explanation. This goes a long way towards helping me understand the philosophy of ggplot. – Wilduck Jul 30 '12 at 15:26
  • 2
    I've been using ggplot for over a year and I NEVER understood the difference between a mapped or set variable. This is by far the best SO answer I've ever seen, congrats. – Amit Kohli May 15 '15 at 12:04
  • @joran your approach doesn't seem to work with the `group` argument : `could not find function "scale_group"` ... A search [here](http://ggplot2.tidyverse.org/reference/) didn't provide any insight on the proper function call to modify `group` aesthetics either. – theforestecologist May 24 '18 at 15:00
  • 1
    @theforestecologist That's because the `group` aesthetic doesn't generate any scales or guides on its own. It's always sort of modifying something else. You'll never get a legend for the "group" aesthetic. – joran May 24 '18 at 15:07
  • If alpha is outside aes for a boxplot and `alpha = 0` then the outliers are not visible. `show.legend = F` works better in this case. – Harley Jul 17 '21 at 23:20
72

Just add the show.legend = F code after the part where you don't want it.

g <- ggplot(df, aes(x=x, y=y, group=group))
g <- g + geom_line(aes(colour=group))
g <- g + geom_point(aes(colour=group, alpha = .8), show.legend = F)
pistou
  • 2,799
  • 5
  • 33
  • 60
CSV
  • 759
  • 5
  • 4
  • 3
    This is much more intuitive than mapping vs setting aesthetics (although that clears up a lot of misunderstanding too) – Wassadamo Jun 07 '19 at 23:27
10

Another simple option is using the function guides, which makes it possible to remove a particular aesthetic (fill, alpha, color) or multiple from the legend. Here is a reproducible example for removing only alpha legend and removing both alpha and color:

df <- data.frame(x=rep(1:10,2), y=c(1:10,11:20), 
                 group=c(rep("a",10),rep("b",10)))
library(ggplot2)
g <- ggplot(df, aes(x=x, y=y, group=group))
g <- g + geom_line(aes(colour=group))
g <- g + geom_point(aes(colour=group, alpha = .8))
# Remove legend alpha
g + guides(alpha = "none")

# Remove legend alpha and color
g + guides(alpha = "none", color = "none")

Created on 2022-08-21 with reprex v2.0.2

Quinten
  • 35,235
  • 5
  • 20
  • 53
1

For old versions of ggplot2 (versions before 0.9.2, released in late 2012), this answer should work:

I tried this with a colour_scale and it did not work. It appears that the colour_scale_hue item works like a function with a default parameter TRUE. I added scale_colour_hue(legend=FALSE) and it worked.

I am not sure if this is the case for all color scale items in ggplot

Gregor Thomas
  • 136,190
  • 20
  • 167
  • 294
Georgette
  • 11
  • 1
  • 3
    Using `legend` in a `scale_*` call is deprecated, better to do `scale_colour_hue(guide = "none")`. – Gregor Thomas Jun 05 '13 at 17:32
  • 3
    taking into account that the `legend=FALSE` is deprecated, as pointed out by @shujaa comment, this is effectively a duplicate answer, i.e. to add the `guide = "none"` to a `scale_fill/color*` function. – David LeBauer Mar 19 '14 at 17:32