2

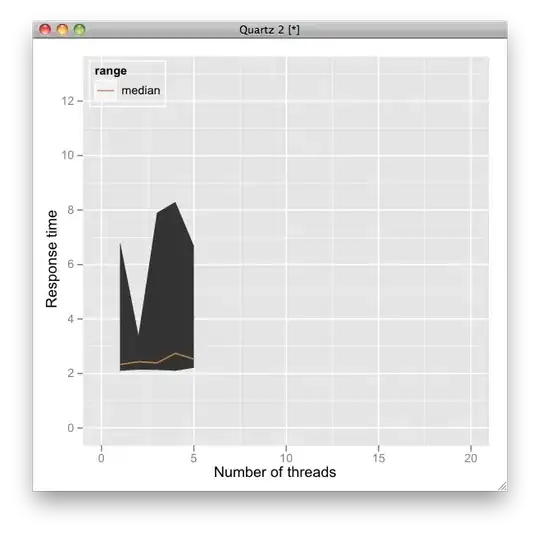
I have 1200 data samples of amplitude data over a 5-minute period, with 4-5 "spikes" in the data. These can be nearby to each other, so "shoulders" can appear. The data can be somewhat noisy as well.

enter image description here

I need to:

  • Programmatically determine the times where these peak occur, and
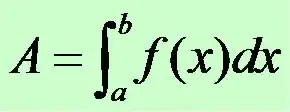
  • Ultimately determine the integral of the curves to find the area under each discrete peak, ignoring the amplitude from nearby neighbors.

The latter requirement makes me think I need to derive a function for each component, and use that function to calculate the area beneath.

Is this a Discrete Wavelet Transform problem? Fourier Transform? Short-time Fourier transform? Something else? Is there a Java library to help with this?

I'm looking for a way to determine the 5 equations that, when added together, yield the original data curve. Probably something like these Gaussian curves (which I just eyeballed)

Gaussian Curve

Sam Barnum
  • 10,559
  • 3
  • 54
  • 60
  • Do the shape of these peaks obey any sort of mathematical model? As in, can the time-domain waveform be expressed as the sum of a bunch of time-offset parametrised peaks? If not, then I don't think there's any meaningful way to isolate them. – Oliver Charlesworth Feb 16 '12 at 15:00
  • @Oli, The peaks are sinusoidal waves (pretty much) – Sam Barnum Feb 16 '12 at 15:10
  • +1. because every post is better with graphs. – Perception Feb 16 '12 at 15:28
  • In some instances, there is more overlap among the components in the graph. I believe this will make it harder to calculate the area of each individual component. If I could derive the individual functions which make up the overall signal, this would be easy. But what is the best way to derive these functions? – Sam Barnum Feb 16 '12 at 16:21

3 Answers3

1

If you have some sort of theoretical model for your peaks (say Gaussian, etc.), then you could do a regression fit for each peak using some number of points around each, and then look up the integral of that model given your derived parameters.

hotpaw2
  • 70,107
  • 14
  • 90
  • 153
  • Hello hotpaw, This sounds very promising. The terminology is mostly new to me, but my curve shapes do appear to be Gaussian. I've added an approximate equation to the sample file. Within Java, how do I go about doing a regression fit? Are you aware of a math library that would help with this, or is it easy to do myself? – Sam Barnum Feb 18 '12 at 00:38
0

to find the peaks you can try something like this...

  • get the three points of your sample
  • comparing the last value with the next you can find where the peaks occur
  • when the current value is greater than the last and next you will have a peak

Here is how make in matlab !

How to detect local maxima and curve windows correctly in semi complex scenarios?

if you get the peak now you can mount the Parabola expression for y-axis, General form of a parabola:

y = ax^2+ bx + c

Then if the Peak of the curve occur at point eg: y = 3 do you have one parabola =:

f(x) = y = -3x^2 + 6x

After that you are required to find where the curve of the x-axis is the beginning and where it ends

Making this you are ready to apply Integral Area!

enter image description here

b = Upper point find in x-axis

a = Lower point find in x-axis

And then finally you have the area

Community
  • 1
  • 1
ederwander
  • 3,410
  • 1
  • 18
  • 23
  • Thanks eder, I'm guessing I would smooth the data before doing this? And how would I calculate the integrals for the curves, given the peak locations? – Sam Barnum Feb 16 '12 at 16:01
  • No problem you can smooth and still will work, besides finding the peak you need to know where it starts and ends to calculate its area – ederwander Feb 16 '12 at 16:21
  • Then make each column infinitely small and you'll get exact area (yay calculus) – Dan Jun 12 '12 at 23:32
0

If I understand your question correctly, this has nothing to do with wavelet or fourier transforms.

To find the peaks, you just loop over each data sample in order and compare neighboring values. Whenever you have a decrease after an increase, you have a peak. In practice, you will need to apply some filtering to prevent detecting false peaks because of noise. A simple average filter, maybe multiple passes should solve your problem if your noise is not too strong. You could do the filtering with fourier-transform, but I am pretty sure it is not needed.

To calculate the area, you can just treat each sample pair as a column. Each column would have equal width (because your samples are equidistant in time), a height of, say, the average of the two samples, and an area of width*height. Then you just sum up the areas of all columns. There are also other methods to get bette precision, like working with parallelograms instead of rectangular columns.

ultimA
  • 298
  • 1
  • 9
  • Thanks for the reply, I've clarified the requirements for the integral portion. Since the signal components which make up the graph can be nearby neighbors, I need to calculate the area for each component without it being affected by output from a nearby neighbor. – Sam Barnum Feb 16 '12 at 16:19