2

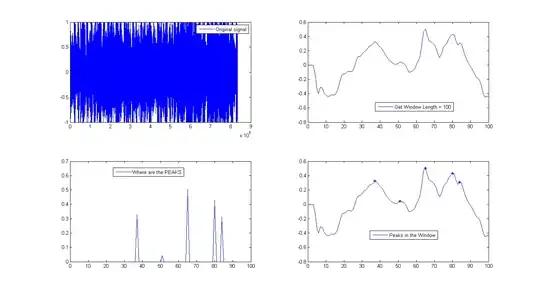
I have a series of data and need to detect peak values in the series within a certain number of readings (window size) and excluding a certain level of background "noise." I also need to capture the starting and stopping points of the appreciable curves (ie, when it starts ticking up and then when it stops ticking down).

The data are high precision floats.

Here's a quick sketch that captures the most common scenarios that I'm up against visually: enter image description here

One method I attempted was to pass a window of size X along the curve going backwards to detect the peaks. It started off working well, but I missed a lot of conditions initially not anticipated. Another method I started to work out was a growing window that would discover the longer duration curves. Yet another approach used a more calculus based approach that watches for some velocity / gradient aspects. None seemed to hit the sweet spot, probably due to my lack of experience in statistical analysis.

Perhaps I need to use some kind of a statistical analysis package to cover my bases vs writing my own algorithm? Or would there be an efficient method for tackling this directly with SQL with some kind of local max techniques? I'm simply not sure how to approach this efficiently. Each method I try it seems that I keep missing various thresholds, detecting too many peak values or not capturing entire events (reporting a peak datapoint too early in the reading process).

Ultimately this is implemented in Ruby and so if you could advise as to the most efficient and correct way to approach this problem with Ruby that would be appreciated, however I'm open to a language agnostic algorithmic approach as well. Or is there a certain library that would address the various issues I'm up against in this scenario of detecting the maximum peaks?

ylluminate
  • 12,102
  • 17
  • 78
  • 152

4 Answers4

2

I'll propose a couple of different ideas. One is to use discrete wavelets, the other is to use the geographer's concept of prominence.

Wavelets: Apply some sort of wavelet decomposition to your data. There are multiple choices, with Daubechies wavelets being the most widely used. You want the low frequency peaks. Zero out the high frequency wavelet elements, reconstruct your data, and look for local extrema.

Prominence: Those noisy peaks and valleys are of key interest to geographers. They want to know exactly which of a mountain's multiple little peaks is tallest, the exact location of the lowest point in the valley. Find the local minima and maxima in your data set. You should have a sequence of min/max/min/max/.../min. (You might want to add an arbitrary end points that are lower than your global minimum.) Consider a min/max/min sequence. Classify each of these triples per the difference between the max and the larger of the two minima. Make a reduced sequence that replaces the smallest of these triples with the smaller of the two minima. Iterate until you get down to a single min/max/min triple. In your example, you want the next layer down, the min/max/min/max/min sequence.

David Hammen
  • 32,454
  • 9
  • 60
  • 108
2

Note: I'm going to describe the algorithmic steps as if each pass were distinct. Obviously, in a specific implementation, you can combine steps where it makes sense for your application. For the purposes of my explanation, it makes the text a little more clear.

I'm going to make some assumptions about your problem:

  1. The windows of interest (the signals that you are looking for) cover a fraction of the entire data space (i.e., it's not one long signal).
  2. The windows have significant scope (i.e., they aren't one pixel wide on your picture).
  3. The windows have a minimum peak of interest (i.e., even if the signal exceeds the background noise, the peak must have an additional signal excess of the background).
  4. The windows will never overlap (i.e., each can be examined as a distinct sub-problem out of context of the rest of the signal).

Given those, you can first look through your data stream for a set of windows of interest. You can do this by making a first pass through the data: moving from left to right, look for noise threshold crossing points. If the signal was below the noise floor and exceeds it on the next sample, that's a candidate starting point for a window (vice versa for the candidate end point).

Now make a pass through your candidate windows: compare the scope and contents of each window with the values defined above. To use your picture as an example, the small peaks on the left of the image barely exceed the noise floor and do so for too short a time. However, the window in the center of the screen clearly has a wide time extent and a significant max value. Keep the windows that meet your minimum criteria, discard those that are trivial.

Now to examine your remaining windows in detail (remember, they can be treated individually). The peak is easy to find: pass through the window and keep the local max. With respect to the leading and trailing edges of the signal, you can see n the picture that you have a window that's slightly larger than the actual point at which the signal exceeds the noise floor. In this case, you can use a finite difference approximation to calculate the first derivative of the signal. You know that the leading edge will be somewhat to the left of the window on the chart: look for a point at which the first derivative exceeds a positive noise floor of its own (the slope turns upwards sharply). Do the same for the trailing edge (which will always be to the right of the window).

Result: a set of time windows, the leading and trailing edges of the signals and the peak that occured in that window.

Bob Cross
  • 22,116
  • 12
  • 58
  • 95
2

my idea is simple, after get your windows of interest you will need find all the peaks in this window, you can just compare the last value with the next , after this you will have where the peaks occur and you can decide where are the best peak.

I wrote one simple source in matlab to show my idea!

My example are in wave from audio file :-)

waveFile='Chick_eco.wav';

[y, fs, nbits]=wavread(waveFile);

subplot(2,2,1); plot(y); legend('Original signal');

startIndex=15000;
WindowSize=100;
endIndex=startIndex+WindowSize-1;
frame = y(startIndex:endIndex);

nframe=length(frame)

%find the peaks 

peaks = zeros(nframe,1);

k=3;

while(k <= nframe - 1)
    y1 = frame(k - 1);
    y2 = frame(k);
    y3 = frame(k + 1);
    if (y2 > 0)
    if (y2 > y1 && y2 >= y3)
        peaks(k)=frame(k);
    end
    end
    k=k+1;
end


peaks2=peaks;
peaks2(peaks2<=0)=nan;


subplot(2,2,2); plot(frame); legend('Get Window Length = 100');


subplot(2,2,3); plot(peaks); legend('Where are the PEAKS');


subplot(2,2,4); plot(frame); legend('Peaks in the Window');
hold on; plot(peaks2, '*');


for j = 1 : nframe
if (peaks(j) > 0)
     fprintf('Local=%i\n', j);
     fprintf('Value=%i\n', peaks(j));   

end
end


%Where the Local Maxima occur
[maxivalue, maxi]=max(peaks)

alt text

you can see all the peaks and where it occurs

Local=37

Value=3.266296e-001

Local=51

Value=4.333496e-002

Local=65

Value=5.049438e-001

Local=80

Value=4.286804e-001

Local=84

Value=3.110046e-001

Community
  • 1
  • 1
ederwander
  • 3,410
  • 1
  • 18
  • 23
0

It looks like the definition of a window is the range of x over which y is above the threshold. So use that to determine the size of the window. Within that, locate the largest value, thus finding the peak.

If that fails, then what additional criteria do you have for defining a region of interest? You may need to nail down your implicit assumptions to more than 'that looks like a peak to me'.

Phil H
  • 19,928
  • 7
  • 68
  • 105