Please Consider :
intense = Reverse[Round[Rationalize /@ N[10^Range[0, 3, 1/3]]]];
values = Range[0, 9/10, 1/10];
intensityLegend = Column[Prepend[MapThread[
Function[{intensity, values},
Row[{Graphics[{(Lighter[Blue, values]),
Rectangle[{0, 0}, {4, 1}], Black,
Text[Style[ToString[intensity], 16, Bold], {2, .5}]}]}]],
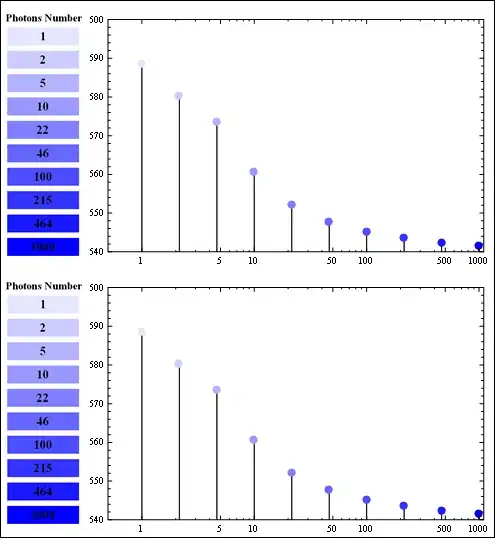
{intense, values}], Text[Style["Photons Number", Bold, 15]]]];
IntersectionDp1={{1., 588.377}, {2.15443, 580.306}, {4.64159, 573.466}, {10.,560.664},
{21.5443, 552.031}, {46.4159, 547.57}, {100.,545.051},
{215.443, 543.578}, {464.159, 542.281}, {1000., 541.346}}
FindD1=ListLogLinearPlot[Map[List, IntersectionDp1],
Frame -> True,
AxesOrigin -> {-1, 0},
PlotMarkers ->
With[{markerSize = 0.04}, {Graphics[{Lighter[Blue, #], Disk[]}],
markerSize} & /@Range[9/10, 0, -1/10]], Filling -> Axis,
FillingStyle -> Opacity[0.8],
PlotRange -> {{.5, 1100}, {540, 600}},
ImageSize->400];
Grid[{{intensityLegend, FindD1}, {intensityLegend, FindD1}},
ItemSize -> {50, 20}, Frame -> True]

How could I get the legend Column Size to Fit the Height of the Plot Area ?
While Row adjust the size I need to use Grid. This is why I duplicated in grid.