I am having trouble with the plotting functions in Mathematica. I am attempting to plot several lists of data on a semilog plot, and then add a legend. The plot is fine:
Show[ListLogPlot[bead31, PlotStyle -> Black,
  PlotMarkers -> {"\[FilledSmallSquare]"}],
 ListLogPlot[bead27, PlotStyle -> Blue,
  PlotMarkers -> {"\[FilledSmallSquare]"}],
 ListLogPlot[A5, PlotStyle -> Red,
  PlotMarkers -> {"\[FilledSmallSquare]"}],
 ListLogPlot[A10, PlotStyle -> Green,
  PlotMarkers -> {"\[FilledSmallSquare]"}],
 ListLogPlot[A20, PlotStyle -> Gray,
  PlotMarkers -> {"\[FilledSmallSquare]"}], Frame -> True,
 FrameLabel -> {Subscript[t, norm], \[Kappa]}, RotateLabel -> False,
 PlotRange -> Automatic]
However, any attempts to add a legend either fail, or are placed in the same scale - and since its a semilog plot, all I see is a line for a legend.
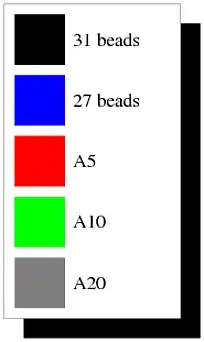
I tried to create my legend separately as a Graphics object:
but I can't figure out how to place it in the image (I was playing with Inset[] and Epilog[], but I think I'm using them wrong).
Show[Graphics[
  Legend[{{Graphics[{Black, Rectangle[{-1, -1}, {1, 1}]}],
     "31 beads"}, {Graphics[{Blue, Rectangle[{-1, -1}, {1, 1}]}],
     "27 beads"},
    {Graphics[{Red, Rectangle[{-1, -1}, {1, 1}]}], "A5"},
    {Graphics[{Green, Rectangle[{-1, -1}, {1, 1}]}], "A10"},
    {Graphics[{Gray, Rectangle[{-1, -1}, {1, 1}]}], "A20"}}]]]
If anyone knows of a way to add a legend properly into the first graph, any help would be much appreciated.