I'm trying to make a map figure of half of Antarctica. I need to plot the western half (the Ross Sea half), from 120ºE to 60ºW.
I've used reference code from a similar question to make the following figure:

I've included the code that I'm using to make this figure below. To cut this map in half at the 120ºE to 60ºW line, I've tried
coord_map("ortho", orientation = c(-90, 210, 0), xlim = (120,-60)) +
which only cut out some sections of the lat + long lines;
scale_x_continuous(limits = c(120, -60), breaks = NULL) +
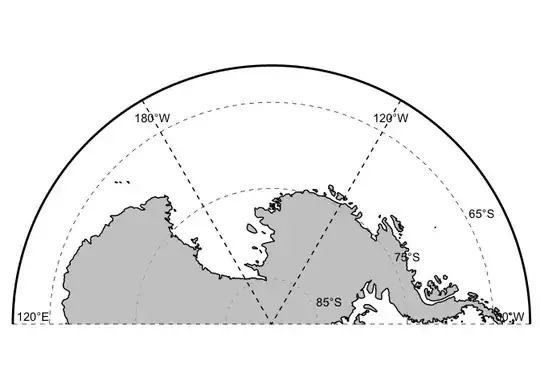
that was close, and made this figure (this is the wrong 1/2):

and many, many iterations of those codes (yes I've tried swapping to c(-60, 120), which made a blank map with lat + long lines on it). I could just crop the image, which I might resort to, but I'd like to find the "correct" solution. Anyway, here's my full reference code:
library("cowplot")
library("googleway")
library("ggplot2")
library("ggrepel")
library("ggspatial")
library("sf")
library("rnaturalearth")
library("rnaturalearthdata")
library("raster")
library("mapproj")
library("rgdal")


# Defines the x axes required
x_lines <- seq(-120,180, by = 60)
wm <- map_data("world")

# Whole Map
ggplot() +
  geom_polygon(data = wm, aes(x = long, y = lat, group = group), fill = "grey", colour = "black", alpha = 0.8) +

  # Convert to polar coordinates
  coord_map("ortho", orientation = c(-90, 210, 0)) +
  scale_y_continuous(limits=c(-90,-60), breaks = seq(-45, -90, by = -10), labels = NULL) +

  # Removes Axes and labels
  scale_x_continuous(breaks = NULL) +
  xlab("") +
  ylab("") +

  # Adds labels
  geom_text(aes(x = 90, y = seq(-55, -85, by = -10), hjust = -0.2, label = paste0(seq(55, 85, by = 10), "°S"))) +
  geom_text(aes(x = x_lines, y = -63, label = c("120°W", "60°W", "0°", "60°E", "120°E", "180°W"))) +

  # Adds axes
  geom_hline(aes(yintercept = -60), size = 1)  +
  geom_segment(aes(y = -60, yend = -90, x = x_lines, xend = x_lines), linetype = "dashed") +

 # Change theme to remove axes and ticks
  theme(panel.background = element_blank(),
        panel.grid.major = element_line(size = 0.25, linetype = 'dashed',colour = "black"),
        axis.ticks=element_blank())