This is a follow-up question of this previous one.
I have understood that the easiest way to attach to a remote process, is by adding "IP_Address:Port" into the "Connection target" textbox.
At first, this gives me an error message, mentioning that the problem might be caused by firewall settings. So, on the remote PC, I have added a firewall setting, allowing incoming traffic for port 4022, and now I have following error message:
Unable to connect to the Microsoft Visual Studio Remote Debugger named '10.39.50.10:4022'.
The connection with the remote endpoint was terminated.
The fact that I have another message than the firewall related one clearly shows that the machine is reached and that the new firewall setting is taken into account.
What else can cause this error message?
Screenshot on my local machine:
Screenshot using RDP for the remote machine:
Now I'm back at this error message, which is the same as in the previous question:
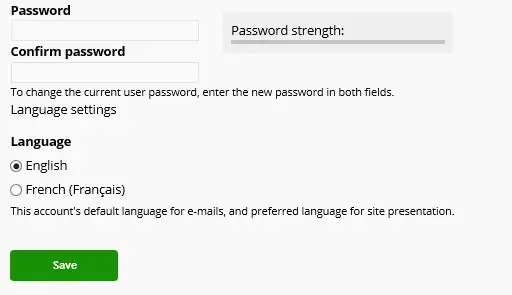
Does anybody know how language settings are managed over remote debugging sessions?
One thing might be interesting: on the remote machine, the monitor's screen mentions Failed attempt to connect from Domain\Username.
A remark about the duplication: the answer on the mentioned duplicate mentions I should start up the monitor as administrator. This has always been the case already, so this does not solve my question.
Extra information on files on the remote machine:
Hereby some information on the used files (I can confirm that the "msvsmon.exe" which is running is the "x86" one):
C:\>dir /S /B msvsmon.exe
C:\Program Files (x86)\Microsoft SQL Server Management Studio 19\Common7\IDE\Remote Debugger\x64\msvsmon.exe
C:\Program Files (x86)\Microsoft SQL Server Management Studio 19\Common7\IDE\Remote Debugger\x86\msvsmon.exe

C:\>dir /S /B vsdebugeng.impl.resources.dll
C:\Program Files (x86)\Microsoft SQL Server Management Studio 19\Common7\Packages\Debugger\1033\vsdebugeng.impl.resources.dll
There is no Visual Studio environment, installed on the remote machine.
On my local machine, Visual Studio's language is English, as you can see here:


