Probably, you should follow both, but start by the second link.
The second link explain how to compute the thickness and store the values as a vertex quality. A vertex quality is just a number stored in each vertex, and in this case the 'Shape Diameter function' will stored the thickness. These numbers can be exported to a file (export the mesh and select the 'quantity' option), or used to compute something, but initially 'cannot be seen' .
The first link explains how to represent those values as colors in the surface of the mesh, so quality values are visible.
If you are interested in the thickness values (not the colors, you can avoid the quality mapper step, and export the mesh just after applying the 'Shape Diameter function'.
To export the thickness values once you have stored them as per vertex quality, you have to use the "Export Mesh As" option, enter a filename with the ".ply" extension and check the option "Quality" under the vertex column and uncheck "Binary encoding"
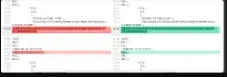
The result is a ascii ply file like this:
ply
format ascii 1.0
comment VCGLIB generated
element vertex 2724
property double x
property double y
property double z
property double quality
element face 5440
property list uchar int vertex_indices
end_header
0.233160783 0.95932031 0.0953535725 0.20976299269
0.462929754 0.81837577 0.0657370521 0.15641355702
0.202524351 0.92948891 -0.146474276 0.17747184249
0.000811799 0.95794361 -0.065255075 0.17676775606
0.450552929 0.82249427 0.3468674341 0.22105761373
0.443139354 0.82520659 -0.268912174 0.19443450433
...
First 11 lines are the ply header, with information about the number of vertex and faces. Each vertex has 4 properties, which are its 3D coordinates and the quality.
So for this file, the thickness are stored in the last column of each vertex. This file format is quite easy to import into matlab/excel (for example, to compute the min, max and average thickness of your model)
If you are interested in colorize the mesh, you can use any of the Colorize by vertex Quality or Quality Mapper methods.
The first is more simple (and probably recommended), just map the quality range to a predefined color function that goes from red (low values) to yellow to blue (high values) colors using a linear ramp.
The second is more complete, so you can personalize the color palette or the shape of the "quality to color curve". Note that the default palette here is flipped, so "blue" mean low values.
If you have colorized the mesh using any method, you can export the RGB colors to a ascii ply file using same options than before but checking the "Color" option after the Vert column.
In this case, each vertex will have 7 properties: X,Y,Z,R,G,B,Quality

