I am trying to debug a deployed service on Azure Cloud by attaching to the process "w3wp.exe".
- Set Remote Debugging - On in Azure Cloud.
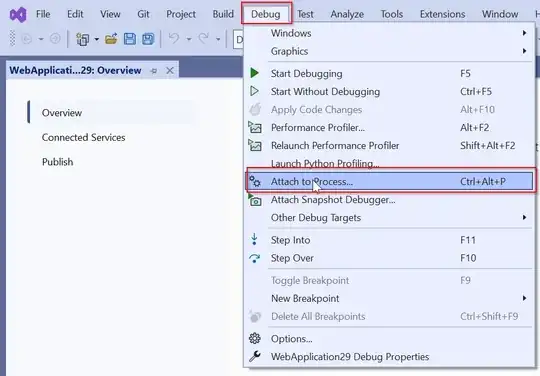
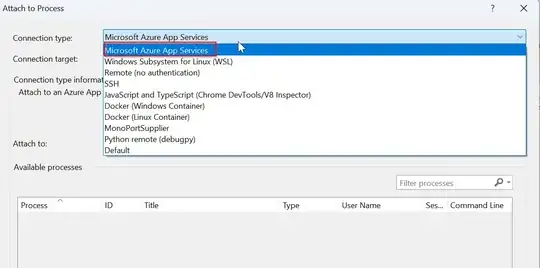
- Debug -> Attach Process -> Connection type: Microsoft Azure App Services -> Login then select the Web App from Cloud -> Select process w3wp
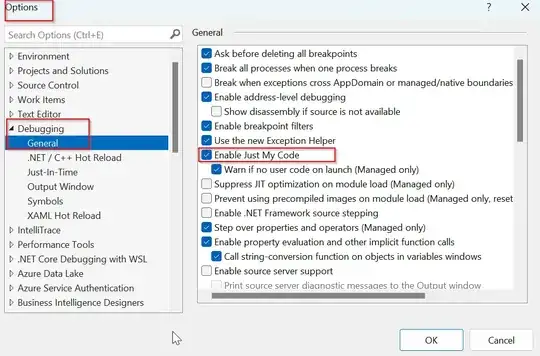
- Tools -> Options -> Debugging
- 'Enable Just My Code' unchecked
Symbols load, takes 1-2 minutes then an error appears:
System.IO.IOException
  HResult=0x80131620
  Message=Unable to read data from the transport connection: The I/O operation has been aborted because of either a thread exit or an application request..
  Source=System.Net.Sockets
  StackTrace:
   at System.Net.Sockets.Socket.AwaitableSocketAsyncEventArgs.ThrowException(SocketError error, CancellationToken cancellationToken)

Inner Exception 1:
SocketException: The I/O operation has been aborted because of either a thread exit or an application request.
- 'Enable Just My Code' checked
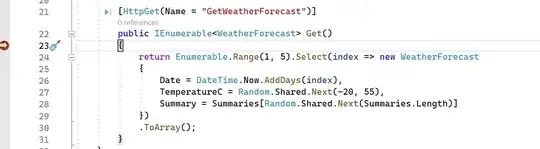
Symbols are not loaded. I put a breakpoint on a simple Get method and VS warns me:The breakpoint will not be hit. Symbols have not been loaded for the current document.
Questions:
- Do you know how can I debug my remote Azure Web app? What am I doing wrong?
- My seniors told me it is no longer possible due to security concerns from Microsoft developers. The remote debugging is now disabled. I don't know if its true.
Do you know any update on this? Can I still from local Visual Studio 2022 attach to an Azure Cloud Web App and debug on my computer the remote application?