3

I have a similar plot drawn with Networkx/Graphviz:

import networkx as nx
from networkx.drawing.nx_agraph import graphviz_layout

T = nx.balanced_tree(2, 5)
pos = graphviz_layout(T, prog="twopi")
nx.draw_networkx(T, pos, with_labels=True)
plt.show()

Which gives me the following plot:

Example Plot 1

What I want:

I want that all the node labels are rotated clockwise around the center of the graph. How do i do this? I would prefer a way directly with Networkx or Graphviz.

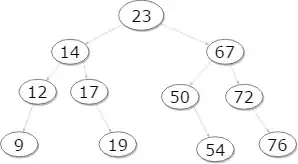
With "rotated clockwise" I mean similar like the labels on this polar plot:

Example Plot 2

I also tried with the following code:

T = nx.balanced_tree(2, 5)
pos = graphviz_layout(T, prog="twopi")
nx.draw_networkx(T, pos, with_labels=False)

text = nx.draw_networkx_labels(T, pos=pos)
for _, t in text.items():
    t.set_rotation('clockwise')
    
plt.show()

But for set_rotation() only 'horizontal', 'vertical', numeric value, or None are supported.

I also found similar questions, but non of which could help me:

Does not plot the node labels and it's a quiet old question from 2017, also it seems for me to complicated: NetworkX node labels relative position

Answer is that it is not possible with graphviz in 2019: https://stackoverflow.com/questions/55009159/change-label-orientation-90º-of-a-node-in-graphviz
2 Answers2

3

A possible workaround of the limitations listed by @sroush is removing the node labels all together and label your nodes using plt.text.

See code below:

import networkx as nx
import matplotlib.pyplot as plt

T = nx.balanced_tree(2, 5)
N_nodes=T.number_of_nodes()
fig,ax=plt.subplots(figsize=(10,5))
#Circular layout as an example
pos = nx.circular_layout(T)

#Setting up the text by using node position 
texts=[plt.text(pos[i][0],pos[i][1],str(i),rotation=(i/N_nodes)*360,fontsize=10,horizontalalignment='center',verticalalignment='center') for i in range(N_nodes)]

#Plot result
nx.draw(T, pos)
ax.set_aspect('equal')
plt.show()

And the output gives:

enter image description here

EDIT: Using graphviz_layout(T, prog="twopi") layout:

import networkx as nx
import matplotlib.pyplot as plt
from networkx.drawing.nx_agraph import graphviz_layout

T = nx.balanced_tree(2, 5)
N_nodes=T.number_of_nodes()
pos = pos = graphviz_layout(T, prog="twopi")
fig,ax=plt.subplots(figsize=(10,5))
texts=[plt.text(pos[i][0],pos[i][1],str(i),rotation=(i/N_nodes)*360,fontsize=10,horizontalalignment='center',verticalalignment='center') for i in range(N_nodes)]
nx.draw(T, pos)
ax.set_aspect('equal')
plt.show()

And the output gives:

enter image description here

EDIT 2: Fine tuning node layout:

import networkx as nx
import matplotlib.pyplot as plt
from networkx.drawing.nx_agraph import graphviz_layout

T = nx.balanced_tree(2, 5)
N_nodes=T.number_of_nodes()
first_rot_node=31
N_rot=T.number_of_nodes()-first_rot_node+1
pos = pos = graphviz_layout(T, prog="twopi")

fig,ax=plt.subplots(figsize=(10,5))
cmt=0
for i in range(N_nodes):
  if i>=first_rot_node:
    cmt+=1
    if ((cmt-1)/N_rot)*360<90 or ((cmt-1)/N_rot)*360>=270:
      plt.text(pos[i][0],pos[i][1],str(i),rotation=((cmt-1)/N_rot)*360,fontsize=11,horizontalalignment='center',verticalalignment='center') 
    elif ((cmt-1)/N_rot)*360>=90 and ((cmt-1)/N_rot)*360<270:
      plt.text(pos[i][0],pos[i][1],str(i),rotation=((cmt-1)/N_rot)*360+180,fontsize=11,horizontalalignment='center',verticalalignment='center') 
  else:
     plt.text(pos[i][0],pos[i][1],str(i),rotation=0,fontsize=11,horizontalalignment='center',verticalalignment='center') 

nx.draw(T, pos)
ax.set_aspect('equal')
plt.show()

And the output gives: enter image description here

jylls
  • 4,395
  • 2
  • 10
  • 21
  • But with this solution the twopi layout or any other layout more complex than a simple circle can not be maintained, correct? – Veritas_in_Numeris Jan 31 '22 at 21:41
  • All you really need for this method to work is the position of your nodes (`pos` variable in my code). This means that it is suitable for many different layout types. See my edited answer for an example with the twopi layout. – jylls Jan 31 '22 at 22:28
  • 1
    Thank you for your patients and your effort, i am not a developer... I see it could go somewhere. In my case, esthetics is also a requirement, is it possible to to rotate the numbers like Node 10, 15 or 13 automatically more accurate towards the middle? also some numbers are not fully in the middle, like Node 15. and last, the numbers start to turn upsite down, like at Node 31, i realized i described the requirement as "rotate clockwise" but i much more seek the arrangement of the labels like in my second example plot. – Veritas_in_Numeris Feb 01 '22 at 13:52
  • 1
    These specifications are fine and manageable. The examples I provided above are mostly here to demonstrate a possible way to do what you want. You will probably have to do some of the fine tuning yourself to get the exact result you want. Here are a couple of directions you can take to get you there. – jylls Feb 01 '22 at 14:42
  • You can control the rotation of each individual node by modifying the value of the `rotation` argument inside the for loop (use if conditions if necessary). The position of the labels compared to the node can be changed bymodifying the values of the `horizontalalignement` and `verticalalignement`. See [doc here](https://matplotlib.org/stable/api/_as_gen/matplotlib.pyplot.text.html) . See edit of my post where I implemented what you described as an example. Happy coding! – jylls Feb 01 '22 at 14:46
1

Graphviz does not support rotated text. Here is an outstanding request to provide this capability - https://gitlab.com/graphviz/graphviz/-/issues/2006.

Two possible Graphviz work-arounds:

sroush
  • 5,375
  • 2
  • 5
  • 11