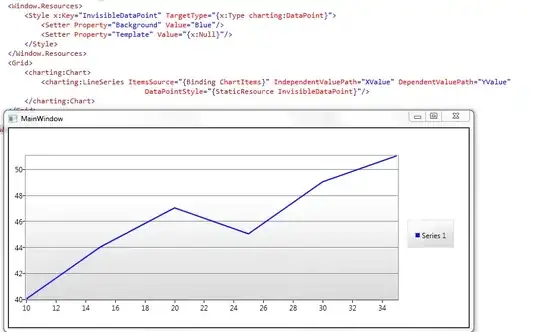
I want to make a gui, which imports the excel data and plot three y axis and one x axis like this. But in contrast to this answer from cem, my axis didn't change when the data changed.

I'm not successful with scale the y axis because I don't know how I can call the Y data from popup callback functions. In my code I marked the problem's section as %%PROBLEM%% . Therefore if you have any tipps for that, please share me about that.
clear all
clc
pkg load io
% Create the Gui Window which will hold all controls and relevant data.
  GuiWindow = figure()

% Static text element used as a title
  uicontrol ("style", "text", "units", "normalized", "string", "Results of Experiments",'ForegroundColor','w','BackgroundColor',[0 0.4470 0.7410],'Fontweight','bold', "horizontalalignment", "center", "position", [0.03 0.9 0.35 0.08] );

% A button for importing (excel) data
  uicontrol ("style", "pushbutton", "units", "normalized", "string", "Datei (.xlsx) mitbringen", "callback", { @pushbutton_Callback, GuiWindow }, "position", [0.03 0.8 0.35 0.08], 'tag', 'button' );

% Popupmenus for selecting appropriate X and Y axis to display in plots
  uicontrol("Style","popupmenu", "units", "normalized", "string","X", "callback", { @popupmenuX_Callback, GuiWindow }, "Position",[0.7 0.04 0.2 0.05], 'tag', 'XAxisMenu' );
  uicontrol("Style","popupmenu", "units", "normalized", "string","Y", "callback", { @popupmenuY_Callback, GuiWindow }, "Position",[0.03 0.5 0.2 0.05], 'tag', 'YAxisMenu' );
  uicontrol("Style","popupmenu", "units", "normalized", "string","Y", "callback", { @popupmenuY_1_Callback, GuiWindow }, "Position",[0.03 0.6 0.2 0.05], 'tag', 'YAxisMenu' );
  uicontrol("Style","popupmenu", "units", "normalized", "string","Y Achse", "callback", { @popupmenuY_2_Callback, GuiWindow }, "Position",[0.03 0.7 0.2 0.05], 'tag', 'YAxisMenu_2' );
  %%=============================================================================
  %% Functions
  %%=============================================================================

  function pushbutton_Callback(hObject, eventdata, GuiWindow)

    % Read in data from file, graphically selected by user
      fileName      = uigetfile('*.xlsx');
      [num,txt,raw] = xlsread(fileName);
      header        = raw(1,:);
      Data          = xlsread(fileName);
    % Show fileName
      button   = findobj('tag', 'button');
      set( button, 'string', fileName)
    % Populate the menu items for the X and Y Axis from the excel header
      XAxisMenu = findobj( 'tag', 'XAxisMenu' );
      set( XAxisMenu, 'string', header );

      YAxisMenu = findobj( 'tag', 'YAxisMenu' );
      set( YAxisMenu, 'string', header );
          % Populate the menu items for the X and Y Axis from the excel header

      YAxisMenu_1 = findobj( 'tag', 'YAxisMenu_1' );
      set( YAxisMenu_1, 'string', header );

      YAxisMenu_2 = findobj( 'tag', 'YAxisMenu_2' );
      set( YAxisMenu_2, 'string', header );

    % Also store headers and data as GuiWindow app data, in case we need them again later.
      setappdata( GuiWindow, 'header', header );
      setappdata( GuiWindow, 'Data'  , Data   );

    % Plot a preliminary plot in the plot area
      XData   = Data(:, 1);
      YData   = Data(:, 1);
      Y_1Data = Data(:, 1);
      Y_2Data = Data(:, 1);

     % An 'axes' object for displaying plots in the Gui Window

      axes ('position', [0.45 0.25 0.5 0.5], 'tag', 'plotarea','ycolor','r');

     % Normalisierung for axes
      yoff = YData - min(YData);
      ynor = yoff / max(yoff);
      y1off = Y_1Data - min(Y_1Data);
      y1nor = y1off / max(y1off);
      y2off = Y_2Data - min(Y_2Data);
      y2nor = y2off / max(y2off);


      %% Plot the data

      plot(XData, ynor, 'r','tag', 'plotobject',...
           XData, y1nor, 'g','tag','plotobject_1', ...
           XData, y2nor, 'b','tag','plotobject_2');
      grid on

      %% Axis inforation
      %%%%%%%%%%PROBLEM%%%%%%%
      ##How can I import YData, Y_1Data and Y_2Data from popupmenu Y Callbacks##
      nticks = 5; #Number of ticks

      yticks(linspace(0, 1, nticks));
      yticklabels(arrayfun(@(a, b, c) sprintf('\\color{red}%6.2f \\color{green}%6.2f \\color{blue}%6.2f', a, b, c), ...
      linspace(min(YData), max(YData), nticks), ...
      linspace(min(Y_1Data), max(Y_1Data), nticks), ...
      linspace(min(Y_2Data), max(Y_2Data), nticks), ...
      'UniformOutput', false));

  endfunction

  %% 2. X Axis Information from excel data import

  function popupmenuX_Callback( hObject, eventdata, GuiWindow )
      Axes      = findobj( 'tag', 'plotarea','-or','tag','plotobject_1' );
      Selection = get( hObject, 'value' );
      XData     = [ getappdata( GuiWindow, 'Data' )( :, Selection ) ];
      PlotObj   = findobj( 'tag', 'plotobject','-or','tag','plotobject_1','-or','tag','plotobject_2');
      set( PlotObj, 'xdata', XData )
  endfunction

  %% 3. Y Axis Information from excel data import

  function popupmenuY_Callback( hObject, eventdata, GuiWindow )
      Axes      = findobj( 'tag', 'plotarea' );
      Selection = get( hObject, 'value' );
      YData     = [ getappdata( GuiWindow, 'Data' )( :, Selection ) ];
      PlotObj   = findobj( 'tag', 'plotobject' );
      set( PlotObj, 'ydata', YData )
  endfunction


  function popupmenuY_1_Callback( hObject, eventdata, GuiWindow )
      Axes      = findobj( 'tag', 'plotarea' );
      Selection = get( hObject, 'value' );
      Y_1Data     = [ getappdata( GuiWindow, 'Data' )( :, Selection ) ];
      PlotObj   = findobj( 'tag', 'plotobject_1' );
      set( PlotObj, 'ydata', Y_1Data )
  endfunction

  function popupmenuY_2_Callback( hObject, eventdata, GuiWindow )
      Axes      = findobj( 'tag', 'plotarea' );
      Selection = get( hObject, 'value' );
      Y_2Data     = [ getappdata( GuiWindow, 'Data' )( :, Selection ) ];
      PlotObj   = findobj( 'tag', 'plotobject_2' );
      set( PlotObj, 'ydata', Y_2Data )
  endfunction