47

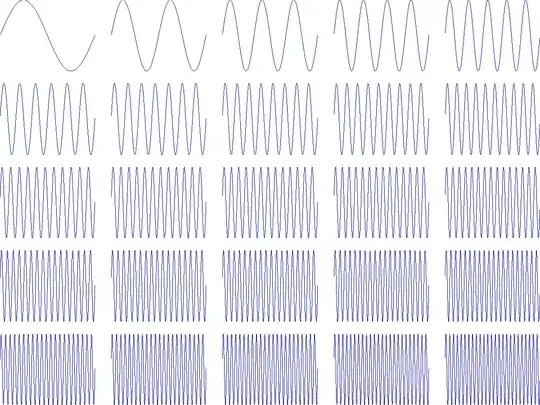
In matlab, an inordinate amount of space is wasted around subplots. For example, in this example:

t = 0:0.001:2*pi+0.001;
figure(2);
for i = 1 : 25;
    subplot(5,5,i);
    plot(t, sin(i*t));
    axis off
end
Example of wasted white space in subplots

over 50% of the space on the figure is wasted as "blank" I'd like to shrink that blank space down, but have been unsuccessful to identify a mechanism to do so. Thoughts?
Cody Gray - on strike
  • 239,200
  • 50
  • 490
  • 574
John
  • 5,735
  • 3
  • 46
  • 62
  • 2
    Here is a list of other possible solutions: [tight subplot](http://www.mathworks.com/matlabcentral/fileexchange/27991-tight-subplot), [jointfig.m](http://www.mathworks.com/matlabcentral/fileexchange/304-jointfig-m), [Some Matlab tricks for making figures](http://nibot-lab.livejournal.com/73290.html), [Useful little utility](http://groups.google.com/group/comp.soft-sys.matlab/browse_thread/thread/5706e8dfbb4a418/f5154f1df6efaff4), [Reduce Grey Space around Images in a Figure](http://www.mathworks.com/matlabcentral/answers/6254-reduce-grey-space-around-images-in-a-figure) – Amro Jun 05 '12 at 15:10
  • Note: As of 2019b, Mathworks has solved this problem with the tiledlayout command. – John Mar 21 '20 at 14:24

3 Answers3

49

The subaxis function on the File Exchange allows you to specify margins for subplots.

Example usage:

t = 0:0.001:2*pi+0.001;
figure(2);
for i = 1 : 25;
    subaxis(5,5,i, 'Spacing', 0.03, 'Padding', 0, 'Margin', 0);
    plot(t, sin(i*t));
    axis tight
    axis off
end

enter image description here

nibot
  • 14,428
  • 8
  • 54
  • 58
7

You can position them yourself (or programatically) using

subplot('Position',[left bottom width height]);

By default, the coordinates are normalized. So a position of [0.1 0.1 0.5 0.5] will start at 10% of the way in from the lower left corner, and will have a width equal to half the figure width, and a height equal to half the figure height.

See the accepted answer for a built-in solution to margins and padding.

Nicolas Renold
  • 557
  • 2
  • 5
6

Try to reduce the default values in the hidden axes LooseInsets property, as described in http://UndocumentedMatlab.com/blog/axes-looseinset-property/

For example:

set(gca, 'LooseInset', get(gca,'TightInset'))
Yair Altman
  • 5,704
  • 31
  • 34
  • At least in my example, this does nothing on 2011a. – John Jul 14 '11 at 20:48
  • the extra space is taken up by the hidden X & Y axes tick labels, and I do not believe they can be eliminated. But you can improve the situation as follows: `figure(2); for i = 1 : 25; hax=axes(); plot(t, sin(i*t)); axis tight; axis off; rowIdx=fix((i-1)/5); colIdx=mod(i-1,5); newPos=[.2*colIdx,0.8-.2*rowIdx,.2,.2]; set(gca,'outer',newPos), end` – Yair Altman Jul 18 '11 at 12:59
  • 1
    Does LooseInset work with subplots ? – roni Sep 16 '13 at 16:19