1

I am trying to create shinyapp in which the first radioGroupButtons will automatically update the second level of radioGroupButtons and then the 3rd level, eventually each level will filter the datatable

used code

library(shiny)
library(reshape2)
library(dplyr)
library(shinyWidgets)

hotdrinks<-list("tea","green tea") 
juices<-list("orange","mango") 
energydrinks<-list("powerhorse","redbull") 
drinks<-list("hotdrinks"=hotdrinks,"juices"=juices,"energydrinks"=energydrinks) 

biscuits<-list("loacker","tuc") 
choc<-list("aftereight","lindt") 
gum<-list("trident","clortes") 
sweets<-list("gum"=gum,"biscuits"=biscuits,"choc"=choc)

all_products<-list("sweets"=sweets,"drinks"=drinks)
mt<-melt(all_products)
mt2<-mt%>%mutate("Price"=c(23,34,23,23,54,32,45,23,12,56,76,43),
             "Quantity"=c(10,20,26,22,51,52,45,23,12,56,76,43))

t1<-mt2[,c(4,3,1,5,6)]
t1
colnames(t1)<-c("CAT","PN","SP","Quantity","Price")

t2<-list(unique(t1$CAT))
t2

all <- list("drinks"=drinks, "sweets"=sweets)

app.R

library(shiny)
library(shinyWidgets)
library(dplyr)


 ui <- fluidPage(titlePanel("TEST"),
            mainPanel(
              fluidRow(
                column( width = 9,  align = "center",
                  radioGroupButtons(inputId = "item",
                    label = "",  status = "success",
                    size = "lg",  direction = "horizontal", justified = FALSE,
                    width = "100%",individual = TRUE,
                    checkIcon = list(
                      "yes" = icon("check"),
                      "yes" = icon("check")
                    ), 
                    choiceNames = as.list(unique(t1$CAT)),
                    choiceValues = as.list(1:length(unique(t1$CAT)))
                  )
                )
              ),
              fluidRow(
                column( width = 9,  align = "center",
                        radioGroupButtons(inputId = "item2",
                                          label = "",  status = "success",
                                          size = "lg",  direction = "horizontal", justified = FALSE,
                                          width = "100%",individual = TRUE,
                                          checkIcon = list(
                                            "yes" = icon("check"),
                                            "yes" = icon("check"),
                                            "yes" = icon("check"),
                                            "yes" = icon("check")
                                          ), 
                                          choiceNames = NULL,
                                          choiceValues = NULL
                 ))),
              fluidRow(
                column( width = 9,  align = "center",
                        radioGroupButtons(inputId = "item3",
                                          label = "",  status = "success",
                                          size = "lg",  direction = "horizontal", justified = FALSE,
                                          width = "100%",individual = TRUE,
                                          checkIcon = list(
                                            "yes" = icon("check"),
                                            "yes" = icon("check"),
                                            "yes" = icon("check"),
                                            "yes" = icon("check")
                                          ), 
                                          choiceNames = NULL,
                                          choiceValues = NULL
                        ))),

              fluidRow(
                column( width = 9,
                wellPanel(dataTableOutput("out"))
              ))))

 server <- function(input, output) {
   observeEvent({
     print(input$item)
         oi<-t1%>%filter(CAT==input$item)%>%select(PN)
         updateRadioGroupButtons(session, inputId="item2", 
                        choiceNames =unique(oi),
                        choiceValues = as.list(1:length(unique(t1$PN))))

             ox<-t1%>%filter(CAT==input$item2)%>%select(SP)
             updateRadioGroupButtons(session, inputId="item3", 
                        choiceNames =unique(ox),
                        choiceValues = as.list(1:length(unique(t1$SP))))

             })
   out_tbl <- reactive({
     x <- ox[,c("Quantity","Price")]
     })
   output$out <- renderDataTable({
     out_tbl()
     },options = list(pageLength = 5)
   )
   }

 shinyApp(ui=ui,server=server)

the desired result is like this image
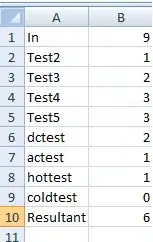
I used this as reference

UPDATED CODE----------------


hotdrinks<-list("tea","green tea") 
juices<-list("orange","mango") 
energydrinks<-list("powerhorse","redbull") 
drinks<-list("hotdrinks"=hotdrinks,"juices"=juices,"energydrinks"=energydrinks) 

biscuits<-list("loacker","tuc") 
choc<-list("aftereight","lindt") 
gum<-list("trident","clortes") 
sweets<-list("gum"=gum,"biscuits"=biscuits,"choc"=choc)

all_products<-list("sweets"=sweets,"drinks"=drinks)
mt<-melt(all_products)
mt2<-mt%>%mutate("Price"=c(23,34,23,23,54,32,45,23,12,56,76,43),
                 "Quantity"=c(10,20,26,22,51,52,45,23,12,56,76,43))

t1<-mt2[,c(4,3,1,5,6)]
t1
colnames(t1)<-c("CAT","PN","SP","Quantity","Price")
mtx<-t1
df<-mtx

library(shiny)
library(shinyWidgets)
library(dplyr)

# make a data frame for choices


buttons_ui <- function(id) {
  ns <- NS(id)
  uiOutput(ns("buttons"))
}

buttons_server <- function(input, output, session, button_names, button_status) {

  output$buttons <- renderUI({
    ns <- session$ns

    radioGroupButtons(
      inputId = ns("level"),
      label = "",
      status = button_status(),
      size = "lg",
      direction = "horizontal",
      justified = TRUE,
      width = "100%",
      individual = TRUE,
      checkIcon =  setNames(
        object = lapply(button_names(), function(x)
          icon("check")),
        nm = rep("yes", length(button_names()))
      ),
      choiceNames = button_names(),
      choiceValues = button_names()
    )
  })

  selected <- reactive({ 
    input$level
  })

  return(selected) 
}

ui <- fluidPage(mainPanel(fluidRow(
  column(
    width =9,
    align = "center",
    buttons_ui(id = "level1"),
    buttons_ui(id = "level2"),
    buttons_ui(id = "level3"),
    tags$hr(),
    dataTableOutput("tbl")
  )
)))

server <- function(input, output, session) {
  selected1 <-
    callModule(module = buttons_server,
               id = "level1",
               button_names = reactive({ unique(mtx$CAT) }), 
               button_status = reactive({ "success"}) )

  selected2 <-
    callModule(
      module = buttons_server,
      id = "level2",
      button_names = reactive({ mtx %>% filter(CAT == selected1() ) %>% pull(PN) %>% unique }),
      button_status = reactive({ "primary" })
    )

  selected3 <-
    callModule(
      module = buttons_server,
      id = "level3",
      button_names = reactive({ mtx %>% filter(CAT == selected1(),PN==selected2() )%>%pull(SP) %>% unique }),
      button_status = reactive({ "warning" })
    )
  # add more calls to the module server as necessary

  output$tbl <- renderDataTable({
    df %>% filter(CAT == req(selected1()), PN == req(selected2()),SP == req(selected3()))
  })
}
shinyApp(ui, server)
John Smith
  • 278
  • 2
  • 10

2 Answers2

4

You can update choices dynamically in observeEvents, here's a demo:

# Data
dat <- data.frame(
  stringsAsFactors=FALSE,
  L3 = c(1L, 2L, 1L, 2L, 1L, 2L, 1L, 2L, 1L, 2L, 1L, 2L),
  L2 = c("gum", "gum", "biscuits", "biscuits", "choc", "choc",
         "hotdrinks", "hotdrinks", "juices", "juices", "energydrinks",
         "energydrinks"),
  L1 = c("sweets", "sweets", "sweets", "sweets", "sweets", "sweets",
         "drinks", "drinks", "drinks", "drinks", "drinks", "drinks"),
  Price = c(23, 34, 23, 23, 54, 32, 45, 23, 12, 56, 76, 43),
  Quantity = c(10, 20, 26, 22, 51, 52, 45, 23, 12, 56, 76, 43),
  value = c("trident", "clortes", "loacker", "tuc",
            "aftereight", "lindt", "tea", "green tea", "orange",
            "mango", "powerhorse", "redbull")
)


# Packages
library(dplyr)
library(shiny)
library(shinyWidgets)


# App
ui <- fluidPage(
  tags$br(),

  # Custom CSS
  tags$style(
    ".btn-group {padding: 5px 10px 5px 10px;}",
    "#l1 .btn {background-color: #5b9bd5; color: #FFF;}",
    "#l2 .btn {background-color: #ed7d31; color: #FFF;}",
    "#value .btn {background-color: #ffd966; color: #FFF;}"
  ),


  tags$br(),
  fluidRow(
    column(
      width = 4,
      offset = 4,
      radioGroupButtons(
        inputId = "l1",
        label = NULL,
        choices = unique(dat$L1),
        justified = TRUE,
        checkIcon = list(
          "yes" = icon("check")
        ), 
        individual = TRUE
      ),
      radioGroupButtons(
        inputId = "l2",
        label = NULL,
        choices = unique(dat$L2),
        justified = TRUE,
        checkIcon = list(
          "yes" = icon("check")
        ), 
        individual = TRUE
      ),
      radioGroupButtons(
        inputId = "value",
        label = NULL,
        choices = unique(dat$value),
        justified = TRUE,
        checkIcon = list(
          "yes" = icon("check")
        ), 
        individual = TRUE
      ),
      tags$br(),
      DT::DTOutput("table")
    )
  )
)

server <- function(input, output, session) {

  observeEvent(input$l1, {
    updateRadioGroupButtons(
      session = session,
      inputId = "l2",
      choices = dat %>% 
        filter(L1 == input$l1) %>%
        pull(L2) %>%
        unique,
      checkIcon = list(
        "yes" = icon("check")
      )
    )
  })

  observeEvent(input$l2, {
    updateRadioGroupButtons(
      session = session,
      inputId = "value",
      choices = dat %>% 
        filter(L1 == input$l1, L2 == input$l2) %>%
        pull(value) %>%
        unique,
      checkIcon = list(
        "yes" = icon("check")
      )
    )
  })

  output$table <- DT::renderDataTable({
    dat %>% 
      filter(L1 == input$l1, 
             L2 == input$l2,
             value == input$value)
  })

}

shinyApp(ui, server)

Result lokk like:

enter image description here

Victorp
  • 13,636
  • 2
  • 51
  • 55
1

As @r2evans suggests one way to get this behavior is with uiOutput and renderUI. Here is a minimal app:

library(shiny)
library(shinyWidgets)
library(dplyr)

# make a data frame for choices

level1 <- LETTERS[1:3]
level2 <- 1:5

df <- expand.grid(level1, level2, stringsAsFactors = FALSE) %>% 
  mutate(Var2=paste(Var1, Var2)) %>% 
  arrange(Var1)

ui <- fluidPage(
  mainPanel(
    fluidRow(
      column(width = 3, "some space"),
      column(
        width = 9,
        align = "center",
        radioGroupButtons(
          inputId = "level1",
          label = "",
          status = "success",
          size = "lg",
          direction = "horizontal",
          justified = FALSE,
          width = "100%",
          individual = TRUE,
          checkIcon =  setNames(
            object = lapply(unique(df$Var1), function(x) icon("check")),
            nm = rep("yes", length(unique(df$Var1)))),
          choiceNames = unique(df$Var1),
          choiceValues = unique(df$Var1) 
        ),
        uiOutput("level2"),
        tags$hr(),
        dataTableOutput("tbl")
      )
    )
))

server <- function(input, output, session) {

  # render the second level of buttons
  make_level <- reactive({

    df2 <- filter(df, Var1 %in% input$level1)

    radioGroupButtons(
      inputId = "level2",
      label = "",
      status = "primary",
      size = "lg",
      direction = "horizontal",
      justified = FALSE,
      width = "100%",
      individual = TRUE,
      checkIcon =  setNames(
        object = lapply(unique(df2$Var2), function(x) icon("check")),
        nm = rep("yes", length(unique(df2$Var2)))),
      choiceNames = as.list(unique(df2$Var2)),
      choiceValues = as.list(unique(df2$Var2))
    )
  })

  output$level2 <- renderUI({
    make_level()
  })

  output$tbl <- renderDataTable({
    df %>% filter(Var1 == req(input$level1), Var2 == req(input$level2))
  })

}

shinyApp(ui, server)

Another way to achieve this is with shiny modules. Here is an example of how that might look. This code is more concise, because the radio buttons are defined once as part of the module and then the module is called as necessary. Because dependency between levels, we still need renderUI in the module.

Code:

library(shiny)
library(shinyWidgets)
library(dplyr)

# make a data frame for choices

level1 <- LETTERS[1:3]
level2 <- 1:5

df <- expand.grid(level1, level2, stringsAsFactors = FALSE) %>%
  mutate(Var2 = paste(Var1, Var2)) %>%
  arrange(Var1)

buttons_ui <- function(id) {
  ns <- NS(id)
  uiOutput(ns("buttons"))
}

buttons_server <- function(input, output, session, button_names, button_status) {

  output$buttons <- renderUI({
    ns <- session$ns

    radioGroupButtons(
      inputId = ns("level"),
      label = "",
      status = button_status(),
      size = "lg",
      direction = "horizontal",
      justified = FALSE,
      width = "100%",
      individual = TRUE,
      checkIcon =  setNames(
        object = lapply(button_names(), function(x)
          icon("check")),
        nm = rep("yes", length(button_names()))
      ),
      choiceNames = button_names(),
      choiceValues = button_names()
    )
  })

  selected <- reactive({ 
    input$level
    })

  return(selected)
}

ui <- fluidPage(mainPanel(fluidRow(
  column(width = 3, "some space"),
  column(
    width = 9,
    align = "center",
    buttons_ui(id = "level1"),
    buttons_ui(id = "level2"),
    # buttons_ui(id = "level3"),
    # buttons_ui(id = "level4"),
    # and so on..
    tags$hr(),
    dataTableOutput("tbl")
  )
)))

server <- function(input, output, session) {
  selected1 <-
    callModule(module = buttons_server,
               id = "level1",
               button_names = reactive({ unique(df$Var1) }), 
               button_status = reactive({ "success"}) )

  selected2 <-
    callModule(
      module = buttons_server,
      id = "level2",
      button_names = reactive({ df %>% filter(Var1 == selected1() ) %>% pull(Var2) %>% unique }),
      button_status = reactive({ "primary" })
    )

  # add more calls to the module server as necessary

  output$tbl <- renderDataTable({
    df %>% filter(Var1 == req(selected1()), Var2 == req(selected2()))
  })
}

shinyApp(ui, server)
teofil
  • 2,344
  • 1
  • 8
  • 17
  • can't thank you enough , one more question, as you see in my data they are 3 levels so when i tried to create ````button_names = reactive({ df %>% filter(Var1 == selected1(),Var2 == selected2() ) %>% pull(Var3) %>% unique }),``` the values not responding – John Smith Dec 09 '19 at 16:41
  • it doesn't show actual names just it shows 1,2,3,4,,, – John Smith Dec 09 '19 at 16:58
  • 1
    What was the error? Might be that the new column is a factor? But hard to tell without the code. – teofil Dec 09 '19 at 16:59
  • Thanks again for your fast response , no error message , level1 and level2 show real names but level 3 shows 1,2,3,,,, – John Smith Dec 09 '19 at 17:12
  • 1
    yes, as I suspected, `SP` is a `factor` (check with `str(mtx)`). Convert `SP` to `character` when you make `mtx` to see names (not levels). Or, when you call the module for the third time, use `as.character` after `pull`. – teofil Dec 09 '19 at 22:25