42

I can't open devtools in the built version of my electron app. Therefore i want to find another solution to log any errors that only occur in the production version.

Is there any good way to get some console.logs from an electron application if its already built? Obviously i can debug the “development” version (running npm run dev) of my electron app by opening the chrome dev tools. But i can’t find any way to enable them inside my production application. I am using the newsest version of electron-vue

Thanks for any help in advance.

Lucca
  • 1,447
  • 4
  • 16
  • 20
  • as far as I know, the electron-vue contains a quite old verion of electron (2.0.4) , while the latest electron version is 15.0 – Siwei Aug 03 '21 at 07:07

10 Answers10

53

Here's what worked for me on Mac.

  1. In terminal type lldb path/to/build.app
  2. In the opened debugger type run --remote-debugging-port=8315. It should open a window of your app.
  3. Open Chrome at http://localhost:8315/
  4. Click on the name of the app. For example, Webpack App.
  5. If you don't see anything in the opened tab, focus on the window of your app.
Timur Osadchiy
  • 5,699
  • 2
  • 26
  • 28
  • Anyone ever run into a situation where the packaged .app works if it's started through this lldb -> run method, but if the .app file is started through Finder, but stays on a loading screen indefinitely? Making it so frustratingly difficult to find the root cause of the issue! This lldb method has been my go-to! – Zack Burt Jan 29 '20 at 20:52
  • 1
    I’m hitting `error: process exited with status -1`, not sure yet whether this is related to my app’s issues or me using `lldb` wrong – Anton Strogonoff Feb 15 '20 at 17:39
  • 5
    For those running into the same issue, `./dist/mac/.app/Contents/MacOS/ --remote-debugging-port=8315` may at least give a glimpse as to where the error is thrown, since it’ll log to console. I couldn’t get to a stage where `http://127.0.0.1:8315` shows anything, though. – Anton Strogonoff Feb 15 '20 at 17:43
  • FYI guys, if you get `error: process exited with status -1` make sure you have the debugging entitlements set, `com.apple.security.cs.debugger` set to `true`. – Arthur Kovacs Aug 13 '22 at 20:03
23

On Mac just run open /Applications/WhatsApp.app --args --remote-debugging-port=8315 and then open http://localhost:8315

bugwheels94
  • 30,681
  • 3
  • 39
  • 60
pTK
  • 659
  • 6
  • 19
23

Launch your Electron application with the --remote-debugging-port=8315 flag set and navigate to chrome://inspect/#devices in Chrome 80+. Then click Configure... and add localhost:8315 as a discovery server.

Then, wait for your Electron instance to appear in the devices list and click inspect.

Richie Bendall
  • 7,738
  • 4
  • 38
  • 58
20

Enabling the Chrome devtools in production can be done in various ways:

  1. A environment variable:
    • E.g. under Windows set ELECTRON_ENV=development&& myapp.exe
  2. Pass a special parameter to your app
    • E.g. myapp.exe --debug
  3. Debug mode via user settings (if you have persistent settings)
  4. Menu entry to open the devtools
    • Can be combined with 1.-3. to only have that menu entry when in debug mode

You can just check if 1.-3. are set and if they are, you simply open the devtools via mainWindow.webContents.openDevTools()

Personally I use a combination of 1., 3. and 4. I simply unlock a developer menu that allows me to open the devtools or opens the userdata folder for me.


If you also want to log critical errors, then electron-log looks like a rather popular option for electron.

RoyalBingBong
  • 1,106
  • 7
  • 15
  • 6
    not works for me (on Mac). Execute with `--remote-debugging-port=8315` and open `http://localhost:8315` works. ref: https://github.com/electron/electron/issues/3331 – PG_ Jun 17 '19 at 05:20
  • If this answer doesn't work for you, consider https://stackoverflow.com/a/61281774/2604813 – Marcus Apr 17 '20 at 22:35
  • That `--debug` argument saved my ass... Very useful to inspect executable console messages! – mliakos Jun 01 '21 at 20:30
15

https://github.com/bytedance/debugtron

Debugtron is an app to debug in-production Electron based app. It is also built with Electron.

elprup
  • 1,960
  • 2
  • 18
  • 32
  • Old one but still works and helped me debug. It's worth noting that you might need the following in your main.js for Debugtron to connect to the app `app.commandLine.appendSwitch('remote-allow-origins', 'devtools://devtools');` – vaskort Jun 25 '23 at 16:57
5

The way to do this is using the --remote-debugging-port flag.

Using Signal as an example, take the following steps:

  1. start the application from the CLI
signal-desktop --remote-debugging-port
  1. Open the debugging URL in a Google Chrome browser (in this case http://localhost:39733/), this will open a page with the app name on it
    .
  2. Click the to open a screen were you can click around to use the app and see output in the devtools
    List item

Alternatively, you can open chrome://inspect/#devices in the Google Chrome browser and click "inspect" (underneath the app name) to open the same window

Potherca
  • 13,207
  • 5
  • 76
  • 94
1

In my case, I had a runtime error crashing Electron before the web view was even shown. Chrome dev tools were not useful for debugging this kind of error.

Even stranger, the app loaded fine using the lldb commands:

lldb ./dist/mac/electron-quick-start-typescript.app
run --remote-debugging-port=8315

I managed to solve by writing the Node.js console log/error to a file. So I could see the console output:

import fs from 'fs';
import util  from 'util';

// use a fixed path, to ensure log shows outside Electron dist
const logPath = `/Users/username/Sites/electron-server/debug-${isDev ? 'dev' : 'prod'}.log`;
const logFile = fs.createWriteStream(logPath, { flags: 'w' });
const logStdout = process.stdout;

console.log = function(...args) {
  logFile.write(util.format.apply(null, args) + '\n');
  logStdout.write(util.format.apply(null, args) + '\n');
}
console.error = console.log;

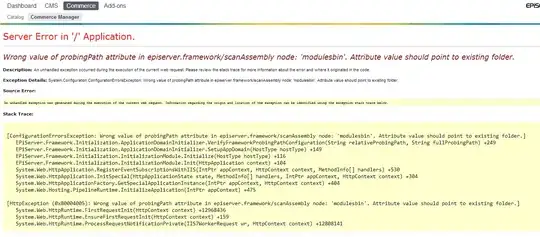
I found the error was a relative path issue. When the app is started in production mode the relative path did not point to the correct location.

I solved by using an absolute path, with Electron getAppPath() method:

- './renderer'
+ app.getAppPath() + '/renderer'
Kim T
  • 5,770
  • 1
  • 52
  • 79
1

June 2022 UPDATE:

Devtools can be explicitly enabled through on the BrowserWindow object.

mainWindow = new BrowserWindows({
   ...,
   webPreferences: {
       ...,
       devTools: true,
   }
}

And then you can manually open it on load.

mainWindow.on('ready-to-show', () => {
    if (!mainWindow) {
        throw new Error('mainWindow is not defined')
    }
    mainWindow.show()

    mainWindow.webContents.openDevTools()
})
0

In the main/index.js at the end of section app.on('ready') just add:

mainWindow.webContents.openDevTools();

Just for debugging, when electron opens an empty window, but the development version works fine, this way is very helpful for me.

0

The answers above don't help for me. ( those with -remote-debugging-port)

put this code into your main.js or similar file, it will automatically open the dev-tool when started.

mainWindow.webContents.openDevTools()
Siwei
  • 19,858
  • 7
  • 75
  • 95