37

I have installed VS Code and the PHP debugger.

I am using xampp.

I tried running the code (2) ways (listen and launch).

Listen just sits there while Launch shows spawn php ENOENT in the debug console.

This is my launch.json.

    {
    "version": "0.2.0",
    "configurations": [

        {
            "name": "Listen for XDebug",
            "type": "php",
            "request": "launch",
            "port": 9000
        },
        {
            "name": "Launch currently open script",
            "type": "php",
            "request": "launch",
            "program": "${file}",
            "cwd": "${fileDirname}",
            "port": 9000
        }
    ]
}

What am I doing wrong?

Tirthraj Barot
  • 2,671
  • 2
  • 17
  • 33
GaryK4
  • 419
  • 1
  • 4
  • 9
  • 2
    Did you enable remote debugging in php.ini? – Alex Slipknot May 04 '17 at 12:59
  • 1
    What is your question? it seems to be unclear for me. – node_modules May 04 '17 at 12:59
  • [XDebug] zend_extension = "php_xdebug-2.5.3-5.5-vc11-nts.dll" ;xdebug.profiler_append = 0 ;xdebug.profiler_enable = 1 ;xdebug.profiler_enable_trigger = 0 ;xdebug.profiler_output_dir = "C:\xampp\tmp" ;xdebug.profiler_output_name = "cachegrind.out.%t-%s" xdebug.remote_enable = 1 xdebug.remote_autostart = 1 xdebug.remote_handler = "dbgp" xdebug.remote_host = localhost xdebug.remote_port = 9000 xdebug.trace_output_dir = "C:\xampp\tmp" – GaryK4 May 05 '17 at 13:33
  • 1
    I don't know how to format a comment and 5 minute time limit was hit. – GaryK4 May 05 '17 at 13:40
  • 2
    I just wrote a public gist with this and other information, so I don't forget. take a look if it helps: https://gist.github.com/MetalFatigue82/850c39a8e1f9d87715c2a62421e40c04 – Pedro Costa Jun 22 '17 at 17:29
  • 1
    I've written a complete guide here: https://www.cloudways.com/blog/php-debug-with-xdebug/ – Shahroze Nawaz Apr 04 '19 at 12:52

11 Answers11

39

Made it just now:

  1. We have OS Windows with Microsoft Visual Code and we have installed 'PHP Debug' module https://marketplace.visualstudio.com/items?itemName=felixfbecker.php-debug#overview Steps to make it working already wroten here, but I'll write again:

  2. Install XDebug. Online Wizard https://xdebug.org/wizard.php helps you, just post here phpinfo() data. Save in phpinfo.php this:

    <?php phpinfo(); ?>
    

then open in browser localhost/phpinfo.php, copy everything you see (Ctrl+A then Ctrl+C) to wizard. It shows you obtained info and steps to do: enter image description here

  1. Open shown in instruction php.ini (there are always many php.ini - apache folder has one php.ini, php has php.ini and phpForApache.ini. But phpinfo makes it clear showing which one is really used)

    2.1. and configure it with xdebug.remote_enable = 1 and xdebug.remote_autostart = 1. My working example:

    [XDebug]
    zend_extension = "c:\wamp64\bin\php\php7.1.9\ext\php_xdebug-2.6.0beta1-7.1-vc14-x86_64.dll"    
    xdebug.stopOnEntry = true
    xdebug.profiler_enable = off
    xdebug.profiler_enable_trigger = Off
    xdebug.profiler_output_name = cachegrind.out.%t.%p
    xdebug.profiler_output_dir ="c:/wamp64/tmp"
    xdebug.show_local_vars=0
    ;xdebug.profiler_output_name = "cachegrind.out.%t-%s"
    xdebug.remote_enable = 1
    xdebug.remote_autostart = 1
    xdebug.remote_handler = "dbgp"
    xdebug.remote_host = "127.0.0.1"
    xdebug.remote_log = "C:\wamp64\tmp\xdebug.txt"
    xdebug.remote_port = 9000
    xdebug.trace_output_dir = "C:\wamp64\tmp"
    xdebug.remote_cookie_expire_time = 36000
    
  2. Restart Apache2 webserver.

Also:

For some reason I first got xdebug working on Netbeans for testing, and only then I found option xdebug.remote_autostart = 1 in manual that made it working in VS Code also.

If you are unsure about XDebug installation, check phpinfo page for "with Xdebug" words and check logs/apache_errors.log for "failed loading php_xdebug" (incorrect DDL downloaded). Then check with any other IDE.

Good regards!

cbuchart
  • 10,847
  • 9
  • 53
  • 93
Eluny
  • 574
  • 5
  • 15
  • 1
    just saved my day! I wonder why XDebug's documentation was as explicit as this answer – cbuchart Jul 19 '18 at 14:25
  • 7
    after spending full day, finally got it working after following your comment `xdebug.remote_autostart = 1` – Rashid Shaikh Mar 10 '19 at 18:11
  • 2
    tested on Ubuntu now, it's enought to set only `zend_extension`, `xdebug.remote_autostart` and `xdebug.remote_enable` – Eluny Mar 21 '19 at 14:34
  • I installed the debugging following phpStorm documentation and then I wanted to try Visual Studio Code and it did not work at first, but adding xdebug.remote_autostart=1 solved this for me as well. – gyurisc Apr 14 '19 at 22:15
  • This worked for me - My breakpoints weren't being stopped at. I am running VS Code on MacOS big sur, debuging a remote centos environment. Debugging works fine in PHPStorm, not VSCode. I found I needed to change xdebug.ini on the server (under /etc/php.d), adding in `xdebug_remote_autostart`, restart php-fpm and BINGO! – Gregory Belton Mar 19 '21 at 21:56
  • XDebug 3 wasn't working for me, may be bc of the new settings, so I've installed 2.7.0alpha1 and it works perfectly fine – s0up Oct 03 '21 at 05:58
  • I actually have to spend an entire day making xdebug work, every time there's more than a month between times I've debugged. Don't beat yourself up too much. – Dan Chase Feb 20 '22 at 21:58
  • I spent a day trying to find a solution for xdebug 3 aswell, the solution is to add these two configurations to php.ini `xdebug.mode=debug` and `xdebug.start_with_request=trigger` – FUZIION Dec 22 '22 at 13:39
23

Just done it now in 2021 using xdebug (v3.x), some steps were different, so I am going to cite more details:

Installing xdebug module on your PHP

  1. Run a PHP page calling "phpinfo();" and copy the output content (yes, you can select all text and Ctrl+C) and paste on https://xdebug.org/wizard

  2. The website xdebug.org will answer to you the correct xdebug module version to download (Example: php_xdebug-3.0.4-7.4-vc15-x86_64.dll"), also it will tell you how to install it, which directory and the reference to include on PHP.ini.

  3. Enable xdebug settings to debug mode and enabling the remote step debugger on PHP.ini as the following example that I have used

[XDebug]
xdebug.mode=debug
xdebug.remote_enable=on
xdebug.start_with_request=yes
zend_extension = C:\xampp\php\ext\php_xdebug-3.0.4-7.4-vc15-x86_64.dll

You may need to change these xdebug settings according your situation (for example using another client port), you can see the list of all possible parameters running "phpinfo()". This trick will help you in case you get some issue, also you must ensure "Step debugger is shown as enabled", it also offers links on the right columns related to each topic.
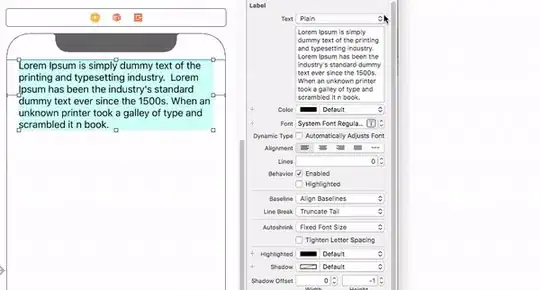
Xdebug settings shown on phpinfo()

So, on the previous settings you can check the host and port if it's as expected as you are going to use on your VS Code.

Setting up your Visual Studio Code

  1. Using extensions tab, search for "PHP Debug" and install it, (worth to tell that the details on the extension page has also it's own tutorial). enter image description here
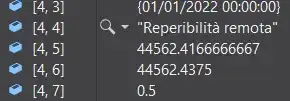
  2. On VS Code menu File->Preferences->Settings, I have added tag for my PHP executable path: enter image description here
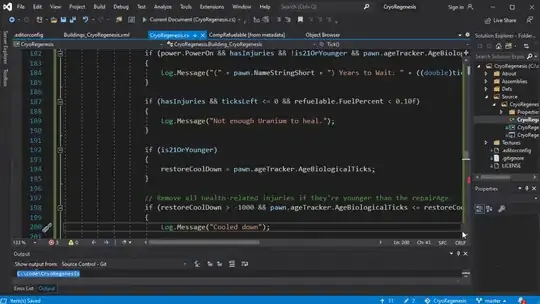
  3. Finally on VS Code debug tab, you will be asked to create a new launch.json file, just click on it and select PHP. The important step here is the section "configurations" on the item "Listen for Xdebug", ensure the port is as same as the port shown on your previous phpinfo() report on XDebug. enter image description here

  4. Ensure your VS Code Project folder is corret and start a new debug using "Lister for Xdebug". enter image description here
In case of some error or nothing happens, focus on checking the XDebug settings shown on "phpinfo()", also the "launch.json" on "Listen for XDebug" section or check the webserver error.log for possible error details.

Best Regards!

AEM
  • 1,354
  • 8
  • 20
  • 30
Tarcisio Júnior
  • 1,097
  • 1
  • 13
  • 25
13

For anyone looking answer today, for me helped changing in php.ini section [XDebug] to this:

xdebug.mode = debug
xdebug.start_with_request = yes
zend_extension = "C:\xampp\php\ext\php_xdebug.dll"
xdebug.stopOnEntry = true
xdebug.profiler_enable = off
xdebug.profiler_enable_trigger = Off
xdebug.profiler_output_name = cachegrind.out.%t.%p
xdebug.output_dir ="c:\xampp\tmp"
xdebug.show_local_vars=0
xdebug.remote_handler = "dbgp"
xdebug.client_host = "127.0.0.1"
xdebug.log = "C:\xampp\tmp\xdebug.txt"
xdebug.client_port = 9000
xdebug.remote_cookie_expire_time = 36000

I used the settings from post of @Eluny, but with some newer version of the XDebug the properties names changed. On documentation page you can find info about changes

Gadziu
  • 657
  • 7
  • 21
7

You just have to do these changes in php.ini file.
For Xdebug v3.x.x : (Note that port number in this version has changed to 9003).

[XDebug]
xdebug.mode = debug
xdebug.start_with_request = yes

For Xdebug v2.x.x:

[XDebug]
xdebug.remote_enable = 1 xdebug.remote_autostart = 1
xdebug.remote_port = 9000

Yasser CHENIK
  • 370
  • 1
  • 6
  • 17
6

Add the following line in your lunch.json file :

"runtimeExecutable": "c:\\xampp\\php\\php.exe"

{
    "version": "0.2.0",
    "configurations": [
        {
            "name": "Listen for XDebug",
            "type": "php",
            "request": "launch",
            "port": 9000
        },
        {
            "name": "Launch currently open script",
            "type": "php",
            "request": "launch",
            "program": "${file}",
            "cwd": "${fileDirname}",
            "port": 9000,
            "runtimeExecutable": "C:\\Program Files\\PHP\\v7.3\\php.exe"
        }
    ]
}
Chris Harrison
  • 5,512
  • 3
  • 28
  • 36
Samir Satpute
  • 69
  • 1
  • 3
  • The "runtimeExecutable" line did it for me, been looking for this for hours! – Luc vd Enden Jul 05 '21 at 09:12
  • did it for me also, but only for the "Launch currently open script" mode, not the "Listen for XDebug" ,so I am not able to debug the whole app, just determined elected file :/ very useful anyhow! – rustyBucketBay Jul 28 '21 at 23:16
2

My VS-Code runs on a windows machine and the web-server with php on a linux machine. Everything was set as mentioned in the posts above but in the

launch.json

I had to set the pathMappings - example:

 {
      "name": "Listen for Xdebug",
      "type": "php",
      "request": "launch",
      "port": 9003,
      "pathMappings": {
        "/var/www/html": "z:\\"
      }
    },

Maybe someone has as similar problem...

Jens
  • 206
  • 1
  • 3
1

Have you checked to make sure the firewall allows Inbound connections on Port 9000? I had this exact problem on one of my development machines. While all other settings were correct I wasn't able to hit the break points. Once I added an exception in the firewall it started working.

So if this is what the issue is with your setting, you have two options to fix it.

  1. Turn OFF your firewall completely, or at least temporarily while you work on your project.
  2. Add an exception to your Firewall settings:
    • Go to your Windows Control Panel and type "Firewall".
    • Select "Inbound Rules" from the left navigation, then click on "New Rule".
    • Select "Port" then hit "Next".
    • Make sure the "Specific local ports" option is selected and type "9000" for the port number.
    • Select "Allow the connection" then hit "Next".
    • Check "Domain", "Private" and "Public" then hit "Next".
    • Enter a descriptive name like "XDebug Port", then hit "Finish".
    • Restart Visual Studio Code, then try debugging again.

Assuming that you have the Web Server portion of the configuration setup correctly this should allow you to debug.

Hope this helps.

DigiOz Multimedia
  • 1,156
  • 1
  • 12
  • 28
1

I’ve restarted everything and still I don’t stop on a breakpoint. Finally, I added this line in php.ini xdebug.remote_port = "9000" Solve my problem.

Andy Chang
  • 11
  • 1
  • This is a common one. With XDebug 3.0, the default port, used when no xdebug.remote_port entry exists in php.ini, was changed from 9000 to 9003, so if you configured your launch.json accordingly the'd have matched too. – Nimral Feb 10 '21 at 12:32
1

In the new version of XDebug 3.0.X some of the parameters of XDebug have beed changed. If your client port 9000, you need also set xdebug.client_port = 9000 in the php.ini file. In the Visual Studio Code open your PHP Project an then click Run -> Add Configuration and change port to 9000. Now you can use option "Listen for XDebug"

V_swan
  • 21
  • 6
0

I would use NetBeans as they have a more proactive Xdebug interface. Also xdebug V3 has a different port (port 9003) so you should make the adjustments. In netbeans and other debuggers will say port 9000 but its 9003 now

Jamie Krcmar
  • 119
  • 1
  • 3
-1

I had a similar problem (no error no output). I later noticed if I make new folder it works, in my case it was hidden files. Make new folder and move your source files to a new folder may solve the problem.

Gerhard
  • 6,850
  • 8
  • 51
  • 81
Vitor
  • 1
  • 1