1

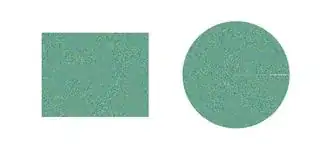
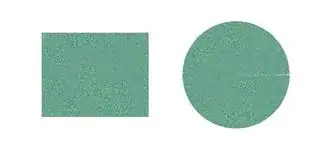
Code which yields a gap at the line from origo (0,0) to (1,0), which seems to reach zero if C dimensions reaches infinity; however, I cannot get it small enough with any sizes of C so I think the artifact can be caused by Matlab figure internal features or image data itself (AnderBiguri) because it does not seem to occur for img=imread('peppers.png'). Code which makes the image, stores it by export_fig and maps it from Cartesian to Polar where the artifact occurs

close all; clear all; clc;

%% Make image
f1=figure;
hax=axes(f1);
x = rand(1,6);
y = exp(rand(1,181));
C = rand(3613,3613);
imagesc(hax, x, y, C); 
box(hax, 'off');
axis(hax, 'off');
set(hax, 'yTickLabel', []);
set(hax, 'xTickLabel', []); % for polar presentation
set(hax, 'Ticklength', [0 0]); % http://stackoverflow.com/a/15529630/54964
filename='/home/masi/Images/testi';
% by default, export_fig has cropping
[img, alpha] = export_fig(filename, '-png', '-native', '-q101', '-a1', '-m1', '-RGB', '-nofontswap', '-dpng', hax);
close all; 

%% Read Image
img=imread('/home/masi/Images/testi.png');
% http://stackoverflow.com/a/7586650/54964
[h,w,~] = size(img);
s = min(h,w)/2; % have here .../1, some phenomenon occurs
[rho,theta] = meshgrid(linspace(0,s-1,s), linspace(0,2*pi,s));
[x,y] = pol2cart(theta, rho);
z = zeros(size(x));
subplot(121), imshow(img)
subplot(122), warp(x, y, z, img)
view(2), axis square tight off

Fig. 1 Output when size(C)=[3613 3613], Fig. 2 Output when size(C)=[36130 36130]

enter image description here enter image description here

Matlab: 2016a
Export_fig: 08/08/16 version
OS: Debian 8.5 64 bit
Linux kernel: 4.6 of backports
Hardware: Asus Zenbook UX303UA
Léo Léopold Hertz 준영
  • 134,464
  • 179
  • 445
  • 697
  • Question: Does this happen for any img? or it only happens with the first chunck of code you posted, after saving, and loading? – Ander Biguri Oct 10 '16 at 17:46
  • 4
    Can not reproduce it with `img=imread('peppers.png');img=img(:,:,1)` – Ander Biguri Oct 10 '16 at 17:49
  • Why are you writing an image only to read it back in??? – Suever Oct 10 '16 at 17:50
  • 3
    I am quite confident that this is happening because you actually have a white line in the image data. – Ander Biguri Oct 10 '16 at 17:50
  • @Suever I have several stages of quality assurance there so I need it, before I do further processing. – Léo Léopold Hertz 준영 Oct 10 '16 at 17:58
  • 1
    Masi, you should add one step of QA there, making sure that there's no white line there after reading it in. As you wrote in a comment, there's *auto* cropping involved, but I can imagine that autocropping is not perfect due to antialiasing or some other reason (compression to jpg then conversion back to png behind the scenes?). You should look at the image you're trying to warp and see if there are any non-green pixels, if all's well there shouldn't be. Right? – Andras Deak -- Слава Україні Oct 10 '16 at 18:03
  • 1
    @AndrasDeak Yes, I forwarded it to the author of the function here https://github.com/altmany/export_fig/issues/175 – Léo Léopold Hertz 준영 Oct 10 '16 at 18:08
  • 1
    I'm very confused. Your code doesn't work in the first place. Line 5 is wrong (you cannot pass a figure handle as an argument to an axes handle), and the imagesc syntax on line 9 is incorrect. How are people reproducing this at all from faulty code? Can you please debug your program above so we can test it? – Tasos Papastylianou Oct 10 '16 at 19:23
  • Also, it seems like you're trying to export the *image* rather than the *figure* (i.e. the contents of the graphical window). Presumably your problem will go away if you use `imwrite` instead? – Tasos Papastylianou Oct 10 '16 at 19:31
  • 2
    @TasosPapastylianou if you check the current docs on [`imagesc`](http://mathworks.com/help/matlab/ref/imagesc.html), especially the `imagesc(ax,___)` syntax, that seems perfectly alright. I guess the handle syntax is new in one of the latest MATLAB versions. I don't see any obvious problems with this code. – Adriaan Oct 10 '16 at 20:04
  • dang ... I can't keep up with matlab anymore! – Tasos Papastylianou Oct 10 '16 at 23:34
  • @Masi I think I understand where the confusion comes from. The wording of your question implied you're trying to get rid of the artifact in the polar plot, and this is what I answered. From our discussion below and edits in the title, it seems to me now that you don't actually care about the polar plot per se, but you're just using it to detect the artefact in the export_fig function. Is that correct? If so, I apologize, if that's the case let me know and I will remove my answer below to avoid confusion. – Tasos Papastylianou Oct 11 '16 at 10:46
  • 1
    Having said that, if the only reason for `export_fig` is publication quality, you might want to consider exporting an image rather than a figure anyway, since export_fig scales the output down. (in my machine with those options, the 3613x3613 image became 475x376) – Tasos Papastylianou Oct 11 '16 at 10:48

2 Answers2

5

I had a quick look at this, and yeah, something strange is happening. The problem is that you have a border around your image, a border that does not seem to be there when plotting the image, because its the same color as the background!

If you create your image with

C = rand(100,100);

and then plot it after loading it with imagesc instead of imshow you can see this:

enter image description here

That is what it gets translated to an band missing in the polar plot. If you just remove the border around the image of size 1, you'll get a full plot.

My best guess is that somewhere inside export_fig either your statement % by default, export_fig has cropping is false or the cropping has some minor bug and takes 1 pixel from the background.

Ander Biguri
  • 35,140
  • 11
  • 74
  • 120
  • 1
    just get the image as `img=img(2:end-1,2:end-1)`, @masi – Ander Biguri Oct 10 '16 at 18:13
  • 1
    @masi you add that after loading export fig data. Before export fig there is no problem, I believe it is export fig who adds that information. You need to add img=img(2:end-1,2:end-1,:) after imread, before size – Ander Biguri Oct 10 '16 at 18:45
  • 1
    @Masi and I am not sure if it always happens, but you can check for it! The value is `[240 240 240]` you can check if all the border has that values, and if it has, remove them. – Ander Biguri Oct 10 '16 at 18:52
  • I think `img=img=(2:end-1,2:end-1)` is not sufficient with color picture. Your color picture will become gray after that. I tried `img=img(2:end-1,2:end-1); Cind = gray2ind(img, 256); Crgb = ind2rgb(Cind, parula(256));` unsuccessfully for the case. Did you manage to get output without the artifact with `export_fig`? – Léo Léopold Hertz 준영 Oct 11 '16 at 14:27
  • 1
    export_fig used to have a 1px minimal padding in case of crop, now removed – Yair Altman Oct 23 '16 at 10:06
0

From the original wording, I understood your question to be:

  1. I'm trying to create a polar transformation (warp) from an existing image (i.e. image data).
  2. I export the image using export_fig. I'm not interested in axes or borders, just the image data, so I'm passing appropriate options to get rid of these.
  3. When I read the resulting file in at a later step, and try to create my polar transformation, I get a weird artifact.
  4. Why does this happen, and how can I get rid of it to have a clean polar plot.

If this is actually the question, then I suggest you don't use export_fig for this, because it's not designed to save image data, it saves a figure. That is, it's a wrapper for the print function with lots of customisations, producing something that you'll use in a publication. It applies appropriate borders, resolution, retains axes, grids, etc etc. And in this particular case with your options, it seems to add a white border of 1-pixel thickness at the bottom of your output image. (yes, this may or may not be a bug and it's worth reporting to the author).

Therefore, if what you're actually trying to do is save the image data instead (i.e. raw pixel rgb values) you should be using imwrite instead. Full example, adapted from your code:

close all; clear all; clc;

%% Make image
f1 = figure; hax = axes();
x = rand(1,6); y = exp(rand(1,181)); % image placement
C = rand(3613,3613);                 % image data
imagesc(x, y, C); 
colormap parula(256); % The colormap in the example (default since 2014b)
box(hax, 'off'); axis(hax, 'off');
set(hax, 'yTickLabel', [], 'xTickLabel', [] , 'Ticklength', [0 0]);
filename='testi.png';

% convert grayscale image to rgb to preserve "colormap" in output file
Cind = gray2ind(C, 256); Crgb = ind2rgb(Cind, parula(256));
imwrite(Crgb, filename, 'png');

%% Read image
img=imread('testi.png');
[h,w,~] = size(img); s = min(h,w)/2;
[rho,theta] = meshgrid(linspace(0,s-1,s), linspace(0,2*pi,s));
[x,y] = pol2cart(theta, rho); z = zeros(size(x));
subplot(1, 2, 1); imagesc(img); axis image off;
subplot(1, 2, 2); warp(x, y, z, img); view(2); axis image off;
colormap parula(256);

Resulting in:

enter image description here

HOWEVER

The question is badly worded. It seems to me after lots of unfortunate heated comments and edits to the original question, that the actual question now seems to be:

  1. I'm using the export_fig function specifically (for reasons I don't want to go into) and I'm trying to use it to export just the image data
  2. The output image has a weird "1-pixel thick bottom border" artefact.
  3. I can demonstrate this visually more clearly to you guys buy transforming this into a polar plot (but the polar plot itself isn't something I care about for my publication).
  4. Is this a bug in export_fig, should I report it to the author, is there a way to get around it?

In which case the answer is "yes this is totally a bug and you should report it".


(Furthermore, if this really is the version of the question you are asking, please make the extra effort to phrase your questions more clearly in the future stating clearly the problem you're trying to solve and steps taken, to avoid wasting people's time answering the wrong thing, and getting into heated discussions over nothing.)

Tasos Papastylianou
  • 21,371
  • 2
  • 28
  • 57
  • 2
    No offense, but I do not like this answer :P . The OP showed a MCVE with `export_fig` (which is a way better form of saving plots for quality , thats why its N1 FEX submission all time), and the error comes from there. Of course if you do not use it the error is not there! This is OK as an alternative, but if someone is using `export_fig` it doesn't really help! – Ander Biguri Oct 11 '16 at 07:17
  • 2
    Also I completely disagree with your postdata! Asking about code specifically working in 2016a is fair enough. We should not discriminate against newer versions, and some problems may arise only using code from those versions. – Ander Biguri Oct 11 '16 at 07:50
  • @AnderBiguri you misunderstood both my points my friend! `export_fig` is an amazing function! I would definitely marry it and have its children, hahah. It's just that it is designed to export a *figure* from a figure handle, not an *image* from a matrix. Reading the code makes me think that OP is only interested in the resulting image in terms of the data of the matrix as pixels – Tasos Papastylianou Oct 11 '16 at 10:21
  • @AnderBiguri also, I didn't mean using newer features is unacceptable. I'm just saying Matlab has the peculiarity that it is not always easy to have the latest version. So unless the question is specifically about a new feature, then by using newer features cuts down the number of people who can test and help down by a lot. But I'll remove my PS since it's cause for misunderstanding, thanks for pointing it out. – Tasos Papastylianou Oct 11 '16 at 10:22
  • @Masi apologies I thought this was what you intended from the second part of the code. What definition have I made up / misunderstood? – Tasos Papastylianou Oct 11 '16 at 10:23
  • @Masi ah, I see you've now changed the topic to be specific to `export_fig`. In my defense, when I answered this question, it just said "why does this polar plot have an artifact" (to which the answer was "because you're exporting the figure as opposed to the image"). – Tasos Papastylianou Oct 11 '16 at 10:26
  • @Masi I'm not sure why you say my `C` is different, I only changed one line. Ok, give me a few minutes and I'll write the complete workflow. :) – Tasos Papastylianou Oct 11 '16 at 10:28
  • I do not understand your use of `gray2ind` because it is main function is to reduce the number of grey levels. It seems that you reduce the number of gray levels such that you convert indexed image to rgb (`ind2rgb`). - - The approach breaks when I applied for bigger sets of data, getting yellow pictures now only. My matrix size can be 30-100 GB, but the output picture is just 1Mb. This is the problem when you pass the matrix directly to `imwrite`. The `export_fig` can take `axes`, which I think is the reason why it works. - - How big matrices can you put to `imwrite`? Maybe, a workaround? – Léo Léopold Hertz 준영 Oct 11 '16 at 15:38
  • 1
    @Masi hm, from your comment, I think you misunderstand slightly how matrices are interpreted as images in matlab, which is a bit of a long topic to cover in a comment. Your png image can have a bitdepth of 8 or 16 bits, (default is 8 unless you specify). A grayscale image in the range [0,1] will be converted to a uint8 image (range [0,255]) before exporting. There is no "gray level reduction", the only difference is I'm applying a colourmap. The *resolution* of the image has nothing to do with its bitdepth, so size shouldn't matter. You're probably just going beyond the defined colormap. – Tasos Papastylianou Oct 11 '16 at 16:28
  • 1
    Also, matlab doesn't specify explicitly, but there shouldn't be a limit to the input to `imwrite`, other than perhaps limited by your computer's memory. However, a matrix of doubles at 30Gb contains roughly 4 billion pixels; presumably you don't want to create an image of that size, you just want something that looks good on paper. Note that just because an image has 4billion pixels, that's not how many you see on screen, the image is scaled and values interpolated to fit the pixels in your screen. export_fig determines the output resolution from your options / screen size, not the data. – Tasos Papastylianou Oct 11 '16 at 16:34
  • 1
    if you want full control in the output resolution, you can `imresize` the image and then `imwrite` it to a file. – Tasos Papastylianou Oct 11 '16 at 16:34
  • @Masi I'm happy to go on private chat if you'd like me to clarify what I mean in more detail :) – Tasos Papastylianou Oct 11 '16 at 16:39