-1

Code 1 where flipping vertically and/or horizontally does not affect axes(); Code 2 where proposed solution does not yield the expected output

close all; clear all; clc;
x = [5 8];
y = [3 6];
C = [0 2 4 6; 8 10 12 14; 16 18 20 22];
C2 = C(:,end:-1:1,:);           %# horizontal flip
C3 = C(end:-1:1,:,:);           %# vertical flip
C4 = C(end:-1:1,end:-1:1,:);    %# horizontal+vertical flip

% https://stackoverflow.com/a/4010203/54964
subplot(2,2,1), imagesc(x,y,C)
subplot(2,2,2), imagesc(x,y,C2)
subplot(2,2,3), imagesc(x,y,C3)
subplot(2,2,4), imagesc(x,y,C4)

%% Rotations of axes() unsuccessfully 
% https://stackoverflow.com/a/15071734/54964
figure
subplot(2,2,1), imagesc(x,y,C)
x = linspace(1, size(C, 2), numel(x)); % reverse only x
set(gca, 'XTick', x, 'XTickLabel', x)
subplot(2,2,2), imagesc(x,y,C2)

x = linspace(1, size(C, 2), numel(x)); % reverse back x
set(gca, 'XTick', x, 'XTickLabel', x)  % reverse y
y = linspace(1, size(C, 1), numel(y));
set(gca, 'YTick', y, 'YTickLabel', flipud(y(:)))
subplot(2,2,3), imagesc(x,y,C3)

x = linspace(1, size(C, 2), numel(x)); % now both x,y reversed
set(gca, 'XTick', x, 'XTickLabel', x)
subplot(2,2,4), imagesc(x,y,C4)

Fig. 1 Output where axis stay untouched but images are flipped correctly, Fig. 2 Output from attempt with moving xticks/yticks

enter image description here enter image description here

Expected output:

  • Fig.1 (top-left) all correct in axes with figure
  • Fig.2 (top-right) y-axis correct but x-axis from 8 to 5
  • Fig.3 (lower-left) y-axis from 6 to 3 but x-axis correct
  • Fig.4 (lower-right) y-axis correct but x-axis from 3 to 6

Attempt 2

Code

% 1 start of vector 2 end of vector 3 length of vector 
figure
subplot(2,2,1), imagesc(x,y,C)
x = linspace(size(C, 2), 1, numel(x)); % reverse only x
set(gca, 'XTick', x, 'XTickLabel', x)
subplot(2,2,2), imagesc(x,y,C2)

x = linspace(1, size(C, 2), numel(x)); % reverse back x
set(gca, 'XTick', x, 'XTickLabel', x)  
y = linspace(size(C, 1), 1, numel(y)); % reverse y
set(gca, 'YTick', y, 'YTickLabel', flipud(y(:)))
subplot(2,2,3), imagesc(x,y,C3)

x = linspace(size(C, 2), 1, numel(x)); % now both x,y reversed
set(gca, 'XTick', x, 'XTickLabel', x)
y = linspace(1, size(C, 1), numel(y)); % reverse y
set(gca, 'YTick', y, 'YTickLabel', flipud(y(:)))
subplot(2,2,4), imagesc(x,y,C4)

Output

Error using matlab.graphics.axis.Axes/set
While setting the 'XTick' property of 'Axes':
Value must be a vector of type single or double whose values increase

Error in test_imagesc_subplot_figure (line 26)
set(gca, 'XTick', x, 'XTickLabel', x)

Eskapp's proposal

I do unsuccessfully the following but no change on Fig. 2; the first row of figures stay in the same increasing order of xaxis; I also tried instead of reverse - normal

figure
subplot(2,2,1), imagesc(x,y,C)
x = linspace(1, size(C, 2), numel(x)); % reverse only x
set(gca,'xdir','reverse')
subplot(2,2,2), imagesc(x,y,C2)
  • Output of Fig. 1 and Fig. 2 axis stay the same

    enter image description here

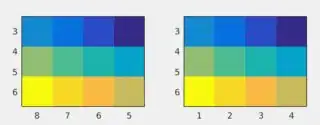
Studying EBH's answer

Output in the y-axis label when using set(gca,'XTick',x,'XTickLabel',x, 'YTick',y,'YTickLabel',fliplr(y)) with variables y=linspace(0,180,181); x=0:0.5:10

enter image description here

Matlab: 2016a
OS: Debian 8.5 64 bit
Hardware: Asus Zenbook UX303UA

Community
  • 1
  • 1
Léo Léopold Hertz 준영
  • 134,464
  • 179
  • 445
  • 697
  • [The documentation clearly explains how to specify axis tick values](https://www.mathworks.com/help/matlab/creating_plots/change-tick-marks-and-tick-labels-of-graph-1.html) – sco1 Oct 07 '16 at 18:04
  • Have you tried using: set(gca,'ydir','normal') ? It sets the origin at the bottom left corner instead of the top left corner. – Eskapp Oct 07 '16 at 19:08
  • 1
    I am currently dealing with very similar problems... Was just giving you an option to test... I stay tuned for when you get a solution. On this thread or another :) PS: I have already voted, cannot do more.. – Eskapp Oct 07 '16 at 19:48
  • Leave the ticks alone and just change the label. – sco1 Oct 07 '16 at 20:08
  • @excaza I do not understand what you mean. Can you be more specific? – Léo Léopold Hertz 준영 Oct 08 '16 at 05:34

1 Answers1

1

If I correctly understand your question, then this code does what you look for:

x = 5:8;
y = 3:6;
C = reshape(0:2:22,4,3).';
C2 = fliplr(C); % horizontal flip
C3 = flipud(C); % vertical flip
C4 = rot90(C,2); % horizontal+vertical flip

% the answer starts here:
subplot(2,2,1), imagesc(x,y,C)
set(gca,'XTick',x,'XTickLabel',x,...
     'YTick',y,'YTickLabel',y)
subplot(2,2,2), imagesc(x,y,C2)
set(gca,'XTick',x,'XTickLabel',fliplr(x),...
     'YTick',y,'YTickLabel',y)
subplot(2,2,3), imagesc(x,y,C3)
set(gca,'XTick',x,'XTickLabel',x,...
     'YTick',y,'YTickLabel',fliplr(y))
subplot(2,2,4), imagesc(x,y,C4)
set(gca,'XTick',x,'XTickLabel',fliplr(x),...
     'YTick',y,'YTickLabel',fliplr(y))

the result:

rot_axes

I changed you x and y from 2-element vectors, but it works also if:

x = [5 8];
y = [3 6];

BTW...

Instead of manipulating C and create C2...C4, you can just write:

subplot 221, imagesc(x,y,C)
subplot 222, imagesc(fliplr(x),y,C)
subplot 223, imagesc(x,fliplr(y),C)
subplot 224, imagesc(fliplr(x),fliplr(y),C)

and add the manipulation on the axis after each call to subplot like before.


Edit:

Using your sizes and limits of the vectors:

x = linspace(0,10,6);
y = linspace(0,180,19); % no need to plot each label
N = 3613;
C = diag(1:N)*ones(N)+rot90(diag(1:N)*ones(N)); % some arbitrary matrix 

where all the rest of the code above remains the same, I get the following result:

rot_ax2

EBH
  • 10,350
  • 3
  • 34
  • 59
  • The last part affects the orientation of my figure so I am now testing your first proposal with my practical data. - - Please, see the body for the output in my practical case. My variables are `y=linspace(0,180,181); x=0:0.5:10;`. How can you affect the sampling of the ranges used for labels? – Léo Léopold Hertz 준영 Oct 09 '16 at 19:09
  • 1
    @Masi, how does your real `C` looks? it's clear that you try to pack too many labels in a short axis. There are 2 problems here: (1) there is no real relation between the elements in `x` or `y` to `C` (too few elements in `C`), and (2) even if `C` was in higher 'resolution' (i.e. more cells) still this is way too much lables to squeeze in one axis. – EBH Oct 09 '16 at 20:26
  • My `size(x)` is `1 6`; `size(y)` is `1 181`, and `size(C)` is `3613 3613`. – Léo Léopold Hertz 준영 Oct 09 '16 at 20:30
  • 1
    @Masi I think you plot too many values from `y`, see my edit. – EBH Oct 09 '16 at 20:46
  • @Masi did this answer your question? – EBH Oct 10 '16 at 18:37
  • @Eskapp, take a look at this answer, to see if it solves your problem too ;) – EBH Oct 12 '16 at 20:10