An "algorithm" that works well with localized data changes.
The critic's view
The Good
The nice part is that it uses a mixture of image processing and graph operations available in most libraries, may be parallelized easily, is reasonable fast, may be tuned to use a relatively small memory footprint and doesn't have to be recalculated outside the modified area if you store the intermediate results.
The Bad
I wrote "algorithm", in quotes, just because I developed it and surely is not robust enough to cope with pathological cases. If your graph has a lot of cycles you may end up with some phantom lines. More on this and examples later.
And The Ugly
The ugly part is that you need to be able to flood fill the map, which is not always possible. I posted a comment a few days ago asking if your graphs can be flood filled, but didn't receive an answer. So I decided to post it anyway.
The Sketch
The idea is:
- Use image processing to get a fine line of pixels representing the center path
- Partition the image in chunks commensurated to the tunnel thinnest passages
- At each partition, represent a point at the "center of mass" of the contained pixels
- Use those pixels to represent the Vertices of a Graph
- Add Edges to the Graph based on a "near neighbour" policy
- Remove spurious small cycles in the induced Graph
- End- The remaining Edges represent your desired path
The parallelization opportunity arises from the fact that the partitions may be computed in standalone processes, and the resulting graph may be partitioned to find the small cycles that need to be removed. These factors also allow to reduce the memory needed by serializing instead of doing calcs in parallel, but I didn't go trough this.
The Plot
I'll no provide pseudocode, as the difficult part is just that not covered by your libraries. Instead of pseudocode I'll post the images resulting from the successive steps.
I wrote the program in Mathematica, and I can post it if is of some service to you.
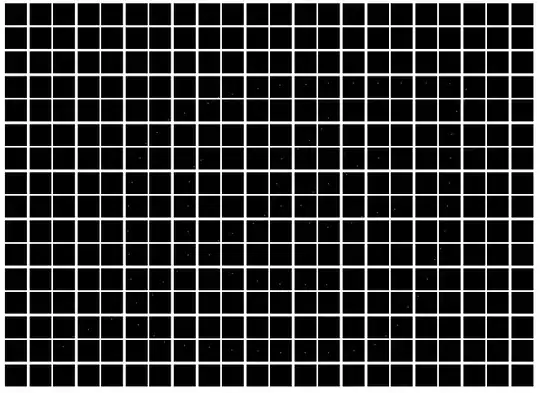
A- Start with a nice flood filled tunnel image
B- Apply a Distance Transformation
The Distance Transformation gives the distance transform of image, where the value of each pixel is replaced by its distance to the nearest background pixel.
You can see that our desired path is the Local Maxima within the tunnel

C- Convolve the image with an appropriate kernel
The selected kernel is a Laplacian-of-Gaussian kernel of pixel radius 2. It has the magic property of enhancing the gray level edges, as you can see below.
D- Cutoff gray levels and Binarize the image
To get a nice view of the center line!
Comment
Perhaps that is enough for you, as you ay know how to transform a thin line to an approximate piecewise segments sequence. As that is not the case for me, I continued this path to get the desired segments.
E- Image Partition
Here is when some advantages of the algorithm show up: you may start using parallel processing or decide to process each segment at a time. You may also compare the resulting segments with the previous run and re-use the previous results

F- Center of Mass detection
All the white points in each sub-image are replaced by only one point at the center of mass
XCM = (Σ i∈Points Xi)/NumPoints
YCM = (Σ i∈Points Yi)/NumPoints
The white pixels are difficult to see (asymptotically difficult with param "a" age), but there they are.
G- Graph setup from Vertices
Form a Graph using the selected points as Vertex. Still no Edges.
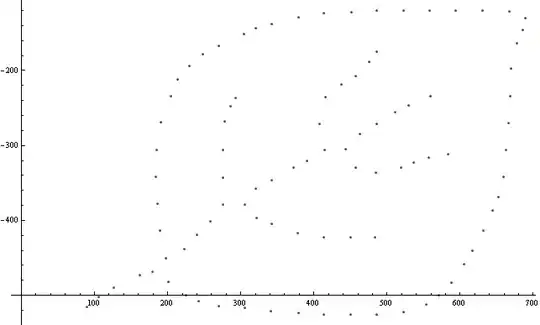
H- select Candidate Edges
Using the Euclidean Distance between points, select candidate edges. A cutoff is used to select an appropriate set of Edges. Here we are using 1.5 the subimagesize.
As you can see the resulting Graph have a few small cycles that we are going to remove in the next step.
H- Remove Small Cycles
Using a Cycle detection routine we remove the small cycles up to a certain length. The cutoff length depends on a few parms and you should figure it empirically for your graphs family

I- That's it!
You can see that the resulting center line is shifted a little bit upwards. The reason is that I'm superimposing images of different type in Mathematica ... and I gave up trying to convince the program to do what I want :)

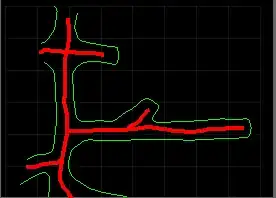
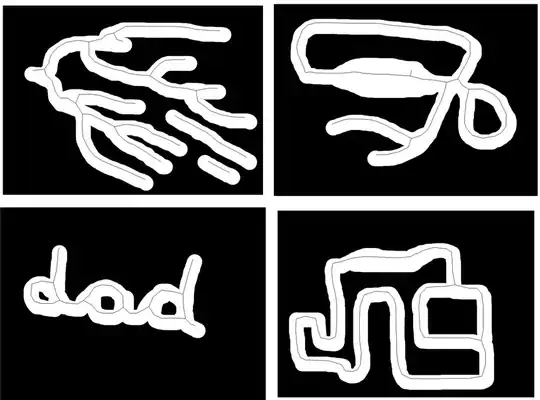
A Few Shots
As I did the testing, I collected a few images. They are probably the most un-tunnelish things in the world, but my Tunnels-101 went astray.
Anyway, here they are. Remember that I have a displacement of a few pixels upwards ...
HTH !
.
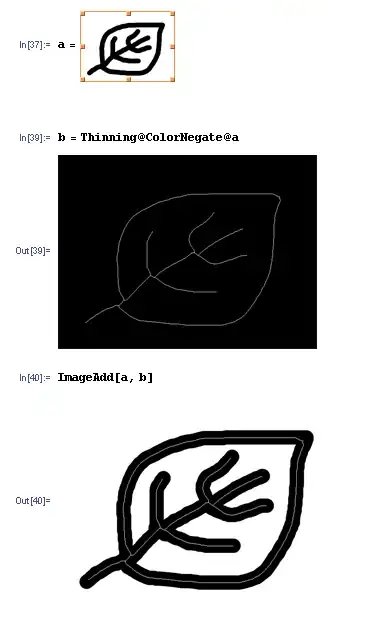
Update
Just in case you have access to Mathematica 8 (I got it today) there is a new function Thinning. Just look: