3

I'm using following code to plot histogram from discrete values:

vect=c(1,1,2,3,4,5,5,1)
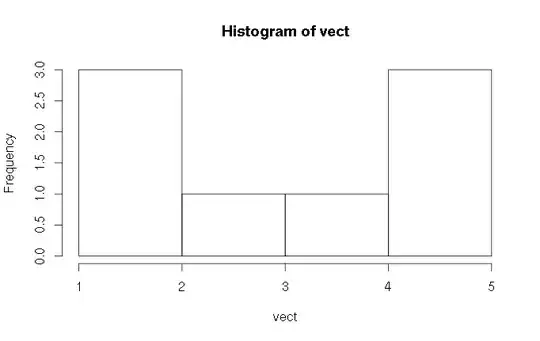
h1=hist(vect, breaks=1:max(vect), right=FALSE)

The output of this is following:

enter image description here

My goal is to have bins separated as it is in following post. I've also tried to apply the code from mentioned post:

vect=c(1,1,2,3,4,5,5,1)
h1=hist(vect, breaks=1:rep(vect,each=2)+c(-.4,.4), right=FALSE)

but it gives an error. 2nd attempt was following code suggested by @TheTime:

vect=c(1,1,2,3,4,5,5,1)
h1=hist(vect, breaks=rep(1:max(vect),each=2)+c(-.4,.4), right=FALSE)

This returned: enter image description here

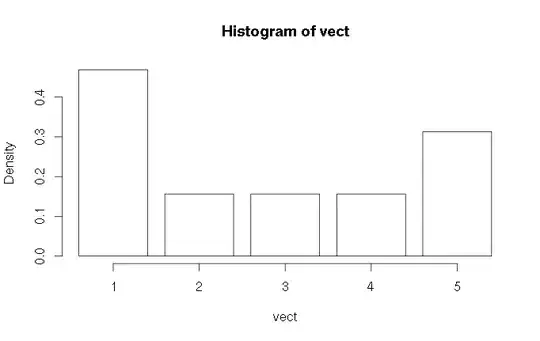
As you can see there are some weird numbers 1 has value 1.6, 2 has value 1.4 etc.

> h1$breaks
 [1] 0.6 1.4 1.6 2.4 2.6 3.4 3.6 4.4 4.6 5.4

What I'm doing wrong?

Community
  • 1
  • 1
Wakan Tanka
  • 7,542
  • 16
  • 69
  • 122
  • 1
    the breaks looks wrong, try `breaks=rep(1:max(vect),each=2)+c(-.4,.4)` – Rorschach Nov 11 '15 at 00:43
  • @TheTime thank you for reply. Seems that `barplot` version is working. Version with `breaks` gives some weird numbers, can you please explain why? Thank you – Wakan Tanka Nov 11 '15 at 00:55
  • @TheTime I've edited OP. Thank you. – Wakan Tanka Nov 11 '15 at 01:10
  • @TheTime `vect=c(1,1,2,3,4,5,5,1) h1=hist(vect, breaks=rep(1:max(vect),each=2)+c(-.4,.4), right=FALSE, freq=FALSE)` gives the same results as `vect=c(1,1,2,3,4,5,5,1) h1=hist(vect, breaks=rep(1:max(vect),each=2)+c(-.4,.4), right=FALSE)` – Wakan Tanka Nov 11 '15 at 01:22
  • @TheTime Oh I see, please make your comment as answer so I can accept it. – Wakan Tanka Nov 11 '15 at 01:35

0 Answers0