According to the answer given in this question Gnuplot smooth confidence interval lines as opposed to error bars I was able to get the same result for my data given by (the error of y is symmetric so it is y plus/minus errorY):
# x y errorY
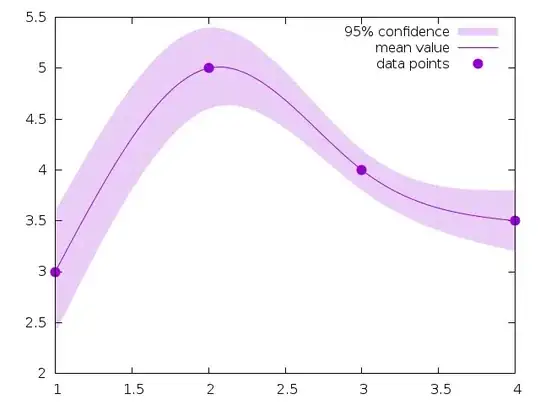
1 3 0.6
2 5 0.4
3 4 0.2
4 3.5 0.3
Code:
set style fill transparent solid 0.2 noborder
plot 'data.dat' using 1:($2-$3):($2+$3) with filledcurves title '95% confidence', \
     '' using 1:2 with lp lt 1 pt 7 ps 1.5 lw 3 title 'mean value'
Now the confidence band is given by connecting every y+errorY and y-errorY point. I would like it if the connection is not just a straight line, but rather a smooth line, like how one can smoothen data points with smooth csplines..