:)
I have a question and did not find any answer by personal search. I would like to make a heatmap with categorical variables (a bit like this one: heatmap-like plot, but for categorical variables ), and I would like to add on the left side a phylogenetic tree (like this one : how to create a heatmap with a fixed external hierarchical cluster ). The ideal would be to adapt the second one since it looks much prettier! ;)
Here is my data:
a newick-formatted phylogenetic tree, with 3 species, let's say:
((1,2),3);a data frame:
x<-c("species 1","species 2","species 3")
y<-c("A","A","C")
z<-c("A","B","A")
df<- data.frame(x,y,z)
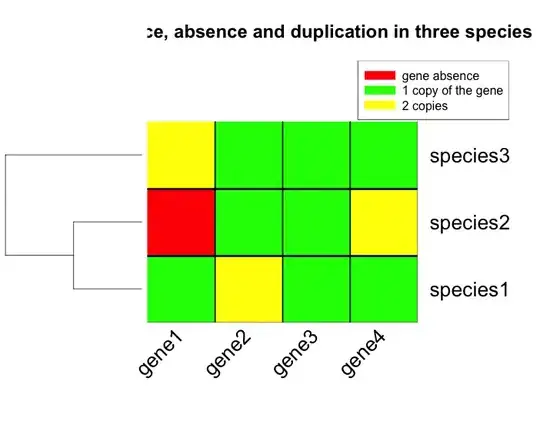
(with A, B and C being the categorical variables, for instance in my case presence/absence/duplicated gene).
Would you know how to do it?
Many thanks in advance!
EDIT: I would like to be able to choose the color of each of the categories in the heatmap, not a classic gradation. Let's say A=green, B=yellow, C=red