I have some numpy array containing data that I would visualize on a 2D grid. Some of the data is unphysical and I would like to mask this data. However, I could not figure out how to set the mask attribute of tricontour correctly. I tried:
import matplotlib.pyplot as mp
import numpy as np

with open('some_data.dat', 'r') as infile:
        x, y, z = np.loadtxt(infile, usecols=(0, 1, 2), unpack=True)
isbad = np.less(z, 1.4) | np.greater(z, 2.1)
mp.tricontourf(x, y, z, mask = isbad)
But the resulting figure is simply not masked. I tried masking part of a contourf plot in matplotlib, i.e.
z2 = np.ma.array(z, mask= isbad)
mp.tricontourf(x, y, z2)
which did not work either. I want to use tricontourf instrad of contourf, because I do not want to grid my data.
z[isbad] = np.nan
results in a Segmentation fault when calling tricontourf
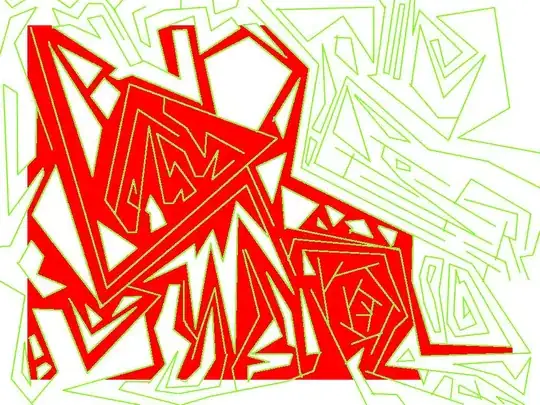
Here's the figure, the red colours are the ones I would like to mark as unphysical.
