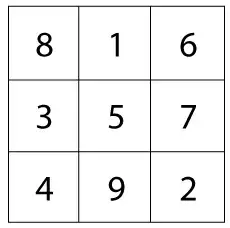
I got a list of number (n=9) and would like to draw them out in a 3*3 square grid and each grid fill with corresponding number. How can I do this in R without installing additional package e.g. plotrix. Many thanks!
I got a list of number (n=9) and would like to draw them out in a 3*3 square grid and each grid fill with corresponding number. How can I do this in R without installing additional package e.g. plotrix. Many thanks!
Here is a ggplot solution that was a little harder than I expected:
# Setup the data
m <- matrix(c(8,3,4,1,5,9,6,7,2), nrow=3, ncol=3)
df <- expand.grid(x=1:ncol(m),y=1:nrow(m))
df$val <- m[as.matrix(df[c('y','x')])]

library(ggplot2)
library(scales)
ggplot(df, aes(x=x, y=y, label=val)) +
  geom_tile(fill='transparent', colour = 'black') +
  geom_text(size = 14) +
  scale_y_reverse() +
  theme_classic() +
  theme(axis.text  = element_blank(),
        panel.grid = element_blank(),
        axis.line  = element_blank(),
        axis.ticks = element_blank(),
        axis.title = element_blank())

Here is a good solution using just base R, and outputting to a png. Note the default png device has equal width and height.
png("magic_square.png")
par(mar=c(.5,.5,.5,.5))
plot(x=df$x,y=df$y,pch=as.character(df$val),
     asp=1, xlim=c(0.5,3.5),ylim=c(0.5,3.5),xaxt="n",yaxt="n",xlab="",ylab="",
xaxs="i", yaxs="i", axes=F)
abline(v=0.5+(0:3),h=0.5+(0:3))
dev.off()
You can use cex in the plot call to make the numbers appear larger.
And you can add circles as follows. Note the abline locations.
symbols(1.5,1.5,circles=1,add=TRUE)
And to annotate as shown in the comment, set the background of the circle and use points to draw additional text annotations.
symbols(1.5,1.5,circles=1,bg="white",add=TRUE)
text(x=1.5,y=1.5,labels="17",cex=3)
Of course the real key to doing this well will be mastering the data structures to make calls into plot, symbols, and text efficient.

Here's one using plotrix (sorry, but it's much easier if you use a package!) and @nograpes's df data.
library(plotrix)
xt <- xtabs(val ~ ., df[c(2,1,3)])
color2D.matplot(xt, vcex = 3, show.values = 1, axes = FALSE, xlab = "",
                ylab = "", cellcolors = rep("white", length(xt)))
In case other answers ever change, df was constructed with
m <- matrix(c(8,3,4,1,5,9,6,7,2), nrow = 3, ncol = 3)
df <- expand.grid(x = 1:ncol(m),y = 1:nrow(m))
df$val <- m[as.matrix(df[c('y', 'x')])]