Here is an example that shows how to hide bars with zero-values. We start with a normal BAR3 plot:
x = 1:7;
Y = jet(numel(x));
h = bar3(x,Y,'detached');
xlabel x; ylabel y; zlabel z; box on;
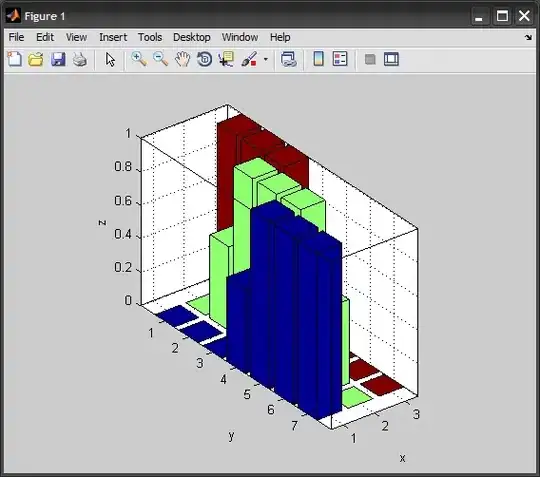
Note that the variable h contains an array of surface handles (3 in this case, one for each "group" of bars. The groups correspond to the columns of the Y matrix, each represented by a different color).
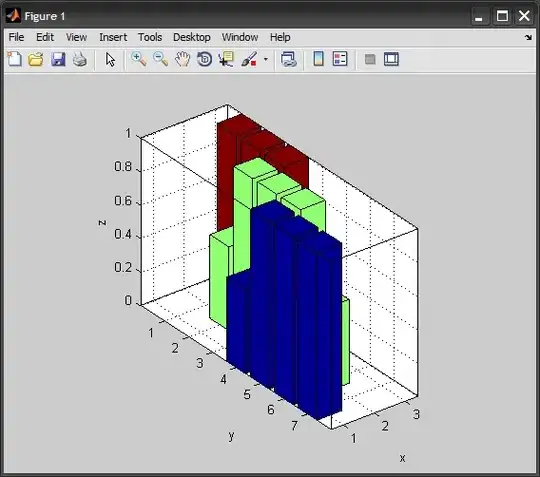
And now the code to hide zero values:
for i=1:numel(h)
    %# get the ZData matrix of the current group
    Z = get(h(i), 'ZData');

    %# row-indices of Z matrix. Columns correspond to each rectangular bar
    rowsInd = reshape(1:size(Z,1), 6,[]);

    %# find bars with zero height
    barsIdx = all([Z(2:6:end,2:3) Z(3:6:end,2:3)]==0, 2);

    %# replace their values with NaN for those bars
    Z(rowsInd(:,barsIdx),:) = NaN;

    %# update the ZData
    set(h(i), 'ZData',Z)
end
Explanation:
For each group of bars, a surface graphic object is created (with handle stored in h(i)). It's Z-coordinates matrix ZData is represented as a 6*N-by-4 matrix (same thing for XData, YData, and CData matrices), where N is the number of rectangular bars in each group or 7 in the example above.
This way each rectangle is represented with 6x4 matrices (one for each of X/Y/Z coordinates). For example the coordinates of one such rectangle would look like:
>> xx = get(h(3),'XData'); yy = get(h(3),'YData'); zz = get(h(3),'ZData');

>> xx(1:6,:)
ans =
          NaN          2.6          3.4          NaN
          2.6          2.6          3.4          3.4
          2.6          2.6          3.4          3.4
          NaN          2.6          3.4          NaN
          NaN          2.6          3.4          NaN
          NaN          NaN          NaN          NaN

>> yy(1:6,:)
ans =
          NaN          0.6          0.6          NaN
          0.6          0.6          0.6          0.6
          1.4          1.4          1.4          1.4
          NaN          1.4          1.4          NaN
          NaN          0.6          0.6          NaN
          NaN          NaN          NaN          NaN

>> zz(1:6,:)
ans =
          NaN            0            0          NaN
            0            1            1            0
            0            1            1            0
          NaN            0            0          NaN
          NaN            0            0          NaN
          NaN          NaN          NaN          NaN
The second column of each traces the points along the left face, the third column traces the points along the right face, and when the two are connected would draw 4 faces of the rectangle:
>> surface(xx(1:6,2:3), yy(1:6,2:3), zz(1:6,2:3), cc(1:6,2:3))
>> view(3)
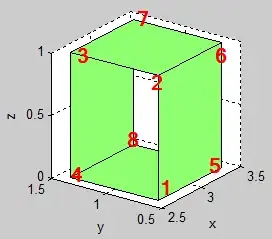
The first and last columns would draw the two remaining faces by closing the sides of the rectangle.
All such matrices are concatenated as one tall matrix, and the rectangles are all drawn using a single surface object. This is achieved by using NaN values to separate the different parts, both inside the points of the same rectangle, and in-between the difference rectangles.
So what the above code does is to look for rectangles where the Z-height is zero, and replace all its values with NaN values which effectively tells MATLAB not to draw the surfaces formed by those points.
