1

You can hide zero values in a bar3 plot, but that solution is not directly applicable to hist3() even though the workaround is similar in fashion.

Here's a workaround based on imdilate() which requires the Image Processing TB and I would like to see suggestions that are Toolbox independent (only Stats TB is ok).
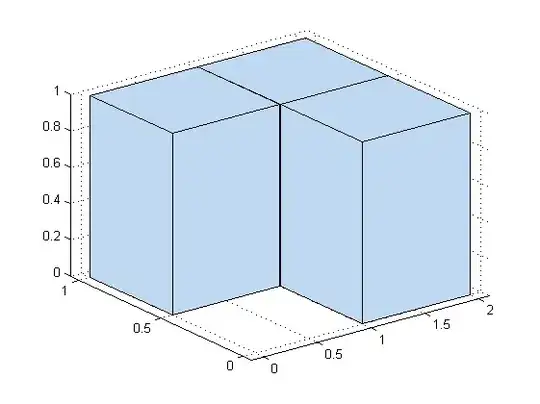
% Example graph
hist3([2 0; 0 1; 1 1],[2 2])

enter image description here

% handle to graph3d.surfaceplot
h = get(gca,'child');

% retrieve the heights
heights       = get(h,'Zdata');

% Index outer heights leaving a contour of zeros
mask          = ~logical(imdilate(heights,ones(3)));

% Set the zero heights to NaN
heights(mask) = NaN;

% Final result
set(h,'ZData',heights)

enter image description here

Here's what happens to heights:

heights =...
    [0     0     0     0     0     0     0     0     0     0
     0     0     0     0     0     0     1     1     0     0
     0     0     0     0     0     0     1     1     0     0
     0     0     0     0     0     0     0     0     0     0
     0     0     0     0     0     0     0     0     0     0
     0     0     0     0     0     0     0     0     0     0
     0     1     1     0     0     0     1     1     0     0
     0     1     1     0     0     0     1     1     0     0
     0     0     0     0     0     0     0     0     0     0
     0     0     0     0     0     0     0     0     0     0]
mask =...
    [1     1     1     1     1     0     0     0     0     1
     1     1     1     1     1     0     0     0     0     1
     1     1     1     1     1     0     0     0     0     1
     1     1     1     1     1     0     0     0     0     1
     1     1     1     1     1     1     1     1     1     1
     0     0     0     0     1     0     0     0     0     1
     0     0     0     0     1     0     0     0     0     1
     0     0     0     0     1     0     0     0     0     1
     0     0     0     0     1     0     0     0     0     1
     1     1     1     1     1     1     1     1     1     1]
heights =...
  [NaN   NaN   NaN   NaN   NaN     0     0     0     0   NaN
   NaN   NaN   NaN   NaN   NaN     0     1     1     0   NaN
   NaN   NaN   NaN   NaN   NaN     0     1     1     0   NaN
   NaN   NaN   NaN   NaN   NaN     0     0     0     0   NaN
   NaN   NaN   NaN   NaN   NaN   NaN   NaN   NaN   NaN   NaN
     0     0     0     0   NaN     0     0     0     0   NaN
     0     1     1     0   NaN     0     1     1     0   NaN
     0     1     1     0   NaN     0     1     1     0   NaN
     0     0     0     0   NaN     0     0     0     0   NaN
   NaN   NaN   NaN   NaN   NaN   NaN   NaN   NaN   NaN   NaN]
Community
  • 1
  • 1
Oleg
  • 10,406
  • 3
  • 29
  • 57
  • funny thing, I started to investigate this but ended up with a solution to the other question: http://stackoverflow.com/a/17477348/97160 . It wasnt until I was done that I realized you were using `hist3` not `bar3` :) – Amro Jul 04 '13 at 19:56

1 Answers1

3

You can replace imdilate(height, ones(3)) with

filter2(ones(3), height)

or

conv2(ones(3), height, 'same') 

and neither require a toolbox.

Mohsen Nosratinia
  • 9,844
  • 1
  • 27
  • 52
  • +1 Now that you mention, I remembered also `conv2(height,ones(3),'same')`. If you include it in your answer I will wait a bit for other answers and accepts the best. – Oleg Jul 04 '13 at 18:26