21

A ggplot2-challenged latticist needs help: What's the syntax to request variable per-facet breaks in a histogram?

library(ggplot2)
d = data.frame(x=c(rnorm(100,10,0.1),rnorm(100,20,0.1)),par=rep(letters[1:2],each=100))
# Note: breaks have different length by par
breaks = list(a=seq(9,11,by=0.1),b=seq(19,21,by=0.2))
ggplot(d, aes(x=x) ) + 
  geom_histogram() + ### Here the ~breaks should be added
  facet_wrap(~ par,  scales="free")

As pointed out by jucor, here some more solutions.

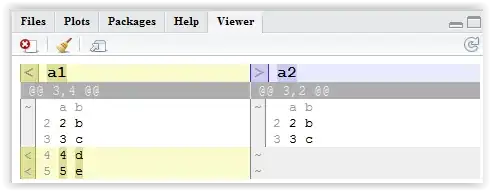
On special request, and to show why I am not a great ggplot fan, the lattice version

library(lattice)
d = data.frame(x=c(rnorm(100,10,0.1),rnorm(100,20,0.1)),par=rep(letters[1:2],each=100))
# Note: breaks have different length by par
myBreaks = list(a=seq(8,12,by=0.1),b=seq(18,22,by=0.2))
histogram(~x|par,data=d,
          panel = function(x,breaks,...){
            # I don't know of a generic way to get the 
            # grouping variable with histogram, so 
            # this is not very generic
            par = levels(d$par)[which.packet()]
            breaks = myBreaks[[par]]
            panel.histogram(x,breaks=breaks,...)
          },
          breaks=NULL, # important to force per-panel compute
          scales=list(x=list(relation="free")))
enter image description here

Dieter Menne
  • 10,076
  • 44
  • 67
  • 1
    As a latticist defender ..can you share please the lattice version.. – agstudy Jun 24 '13 at 09:33
  • 1
    You could do the binning outside of ggplot2, e.g. using `hist` in combination with `ddply` or `data.table` or ..., and make barplots. – Roland Jun 24 '13 at 09:52
  • Yes, that looks like the method to go. Since this is for a package of another author, it would required some work. https://github.com/xfim/ggmcmc/pull/17 – Dieter Menne Jun 24 '13 at 10:02

4 Answers4

17

Here is one alternative:

hls <- mapply(function(x, b) geom_histogram(data = x, breaks = b), 
              dlply(d, .(par)), myBreaks)
ggplot(d, aes(x=x)) + hls + facet_wrap(~par, scales = "free_x")

enter image description here

If you need to shrink the range of x, then

hls <- mapply(function(x, b) {
  rng <- range(x$x)
  bb <- c(rng[1], b[rng[1] <= b & b <= rng[2]], rng[2])
  geom_histogram(data = x, breaks = bb, colour = "white")
}, dlply(d, .(par)), myBreaks)

ggplot(d, aes(x=x)) + hls + facet_wrap(~par, scales = "free_x")

enter image description here

kohske
  • 65,572
  • 8
  • 165
  • 155
  • The Master strikes again. Nevertheless: the lattice solution, if not perfect, is much more transparent. – Dieter Menne Jun 24 '13 at 21:13
  • nice approach. thank you. unfortunately it does not help to apply different binwidth as scaling factor for a density curve... geom_density(data = x, aes(y = binwidth * ..count..)) – Antje Janosch Oct 09 '14 at 13:08
  • Can you explain what is going on inside that first `mapply`? – randy Mar 26 '21 at 03:16
5

I don't think that it is possible to give different break points in each facet.

As workaround you can make two plots and then with grid.arrange() function from library gridExtra put them together. To set break points in geom_histogram() use binwidth= and set one value for width of bin.

p1<-ggplot(subset(d,par=="a"), aes(x=x) ) + 
  geom_histogram(binwidth=0.1) +
  facet_wrap(~ par)

p2<-ggplot(subset(d,par=="b"), aes(x=x) ) + 
  geom_histogram(binwidth=0.2) +
  facet_wrap(~ par)
library(gridExtra)
grid.arrange(p1,p2,ncol=2)

enter image description here

Didzis Elferts
  • 95,661
  • 14
  • 264
  • 201
  • Thanks, I will accept that later if there is no alternative (which I fear). However, for the real job I have some hundreds of histogram for Bayes plots, so it gets messy: see https://github.com/xfim/ggmcmc/pull/17. – Dieter Menne Jun 24 '13 at 09:44
4

Following on from Didzis example:

ggplot(dat=d, aes(x=x, y=..ncount..)) +
  geom_histogram(data = d[d$par == "a",], binwidth=0.1) +
  geom_histogram(data = d[d$par == "b",], binwidth=0.01) +  
  facet_grid(.~ par, scales="free")

EDIT: This works for more levels but of course there are already better solutions

# More facets
d <- data.frame(x=c(rnorm(200,10,0.1),rnorm(200,20,0.1)),par=rep(letters[1:4],each=100))

# vector of binwidths same length as number of facets - need a nicer way to calculate these
my.width=c(0.5,0.25,0.1,0.01)

out<-lapply(1:length(my.width),function(.i) data.frame(par=levels(d$par)[.i],ggplot2:::bin(d$x[d$par==levels(d$par)[.i]],binwidth=my.width[.i])))

my.df<-do.call(rbind , out)

ggplot(my.df) + geom_histogram(aes(x, y = density, width = width), stat =  "identity") + facet_wrap(~par,scales="free")

from https://groups.google.com/forum/?fromgroups=#!searchin/ggplot2/bin$20histogram$20by$20facet/ggplot2/xlqRIFPP-zE/CgfigIkgAAkJ

user20650
  • 24,654
  • 5
  • 56
  • 91
3

It is not, strictly speaking, possible to give different breaks in the different facets. But you can get the same effect by having a different layer for each facet (much as in user20650's answer), but mostly automating the multiple geom_histogram calls:

d <- data.frame(x=c(rnorm(100,10,0.1),rnorm(100,20,0.1)),
                par=rep(letters[1:2],each=100))
breaks <- list(a=seq(9,11,by=0.1),b=seq(19,21,by=0.2))

ggplot(d, aes(x=x)) +
  mapply(function(d, b) {geom_histogram(data=d, breaks=b)}, 
         split(d, d$par), breaks) +
  facet_wrap(~ par,  scales="free_x")

enter image description here

The mapply call creates a list of geom_histograms which can be added to the plot. The tricky part is that you have to manually split the data (split(d, d$par)) into the data that goes into each facet.

Community
  • 1
  • 1
Brian Diggs
  • 57,757
  • 13
  • 166
  • 188