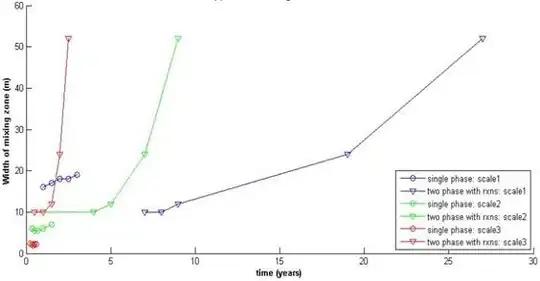
I have various plots (with hold on) as show in the following figure:
I would like to know how to find equations of these six curves in Matlab. Thanks.
I have various plots (with hold on) as show in the following figure:
I would like to know how to find equations of these six curves in Matlab. Thanks.
I found interactive fitting tool in Matlab simple and helpful, though somewhat limited in scope:

The graph above seems to be linear interpolation. Given vectors X and Y of data, where X contains the arguments and Y the function points, you could do
f = interp1(X, Y, x)
to get the linearly interpolated value f(x). For example if the data is
X = [0 1 2 3  4  5];
Y = [0 1 4 9 16 25];
then
y = interp1(X, Y, 1.5)
should give you a very rough approximation to 1.5^2. interp1 will match the graph exactly, but you might be interested in fancier curve-fitting operations, like spline approximations etc.
The advice, though there might be better answer, from me is: try to see the rate of increase in the curve. For example, cubic is more representative than quadratic if the rate of increase seems fast and find the polynomial and compute the deviation error. For irregular curves, you might try spline fitting. I guess there is also a toolbox in matlab for spline fitting.
Does rxns stand for reactions? In that case, your curves are most likely exponential. An exponential function has the form: y = a*exp(b * x) . In your case, y is the width of mixing zone, and x is the time in years. Now, all you need to do is run exponential regression in Matlab to find the optimal values of parameters a and b, and you'll have your equations.
There is a way to extract information with the current figure handle (gcf) from you graph.
For example, you can get the series that were plotted in a graph:
% Some figure is created and data are plotted on it
figure;
hold on;
A = [ 1 2 3 4 5 7] % Dummy data
B = A.*A % Some other dummy data
plot(A,B);
plot(A.*3,B-1);

% Those three lines of code will get you series that were plotted on your graph
lh=findall(gcf,'type','line'); % Extract the plotted line from the figure handle
xp=get(lh,'xdata'); % Extract the Xs
yp=get(lh,'ydata'); % Extract the Ys
There must be other informations that you can get from the "findall(gcf,...)" methods.