5

Actually, in my app, I have created a graph using achartEngine. In these in the x-axis initially, I am displaying value from 1 to 31. Now instead of displaying this is it possible to display values like 1-03-2012, 2-03-2012, 3-03-2012 ... and so on up to last day current month and when it reaches last day of current month i.e. 31-03-2012 the value display after that should be 1-04-2012 2-04-2012...and so on. The code I have used while displaying value like 1 2 3 4 5... is given below. Can anyone help me to solve this out?

code for graph

 renderer = new XYMultipleSeriesRenderer(2);        
    int length = colors.length;     
    for (int i = 0; i < length; i++) 
    {
        XYSeriesRenderer r = new XYSeriesRenderer();
        r.setColor(colors[i]);
        r.setPointStyle(styles[i]);
        renderer.addSeriesRenderer(r);
    }
    
    int rendererLength = renderer.getSeriesRendererCount();
    for (int i = 0; i < rendererLength; i++) 
    {
      ((XYSeriesRenderer) renderer.getSeriesRendererAt(i)).setFillPoints(true);
    }               
    renderer.setAxisTitleTextSize(12);
    renderer.setChartTitleTextSize(12);
    renderer.setLabelsTextSize(10);
    renderer.setLegendTextSize(12);
    renderer.setPointSize(5f);
    
    renderer.setApplyBackgroundColor(true);
    renderer.setBackgroundColor(Color.parseColor("#F5F5F5"));
    renderer.setMarginsColor(Color.parseColor("#F5F5F5"));
    
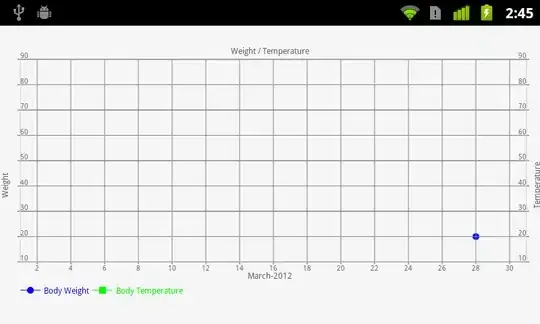
    renderer.setChartTitle("Weight / Temperature");
    renderer.setXLabels(20);
    renderer.setXTitle(sdFormatter.format(currentDate));        
    renderer.setXAxisMin(1);
    renderer.setXAxisMax(nMaxDay);
    renderer.setXLabelsAlign(Align.CENTER);
                
    renderer.setYLabels(10);  
    renderer.setYTitle("Weight", 0);
    renderer.setYTitle("Temperature", 1);
    renderer.setYAxisMin(10, 0);
    renderer.setYAxisMax(90, 0);
    renderer.setYAxisMin(10, 1);
    renderer.setYAxisMax(90, 1);
    renderer.setYAxisAlign(Align.LEFT, 0);
    renderer.setYAxisAlign(Align.RIGHT, 1);
    renderer.setYLabelsAlign(Align.LEFT, 0);
    renderer.setYLabelsAlign(Align.RIGHT, 1);
    
    renderer.setAxesColor(Color.LTGRAY);
    renderer.setLabelsColor(Color.parseColor("#5f5f5f"));          
    renderer.setShowGrid(true);
    renderer.setGridColor(Color.GRAY);

screenshot shot enter image description here

iknow
  • 8,358
  • 12
  • 41
  • 68
AndroidDev
  • 4,521
  • 24
  • 78
  • 126
  • which class you have used in AchartEngineDemo – Abhi Mar 28 '12 at 10:02
  • XYMultipleSeriesRenderer (object of this contain graph attributes like colour) – AndroidDev Mar 28 '12 at 10:03
  • I have used achartengine-0.7.0 .jar and then used the code as they suggested in the doc – AndroidDev Mar 28 '12 at 10:07
  • see you run the project right? it will display list with some options.. which one you selected from list – Abhi Mar 28 '12 at 10:09
  • Actually i created my own project...for reference i take the example of MultipleTemperatureChart.java file..my problem is using renderer for x axis i have renderer.setXAxisMin(1) and renderer.setXAxisMax(nMaxDay). and it display value from 1-31..but if i want to display dates like 1-03-2012, 2-03-2012 then how that can be done – AndroidDev Mar 28 '12 at 10:12
  • let us [continue this discussion in chat](http://chat.stackoverflow.com/rooms/9395/discussion-between-abhi-and-anshuman) – Abhi Mar 28 '12 at 10:14
  • +1 because your code helped me figure out why I couldnt see my labels ;) – Tyler Jul 10 '12 at 20:39
  • it's irreverent here but have any idea how can increase no. of grid block i.e. column and row. – CoDe May 09 '14 at 12:11

2 Answers2

13

Use AverageTemperatureChart class from the Demo.

setChartSettings(renderer, "Average temperature", "Month", "Temperature", 0.5, 5.5, 0, 4,
        Color.LTGRAY, Color.LTGRAY);

then change like this and check the changes

 for (int i = 0; i < titles.length; i++) 
    {
      x.add(new double[] { 1, 2, 3, 4 });
       }

add four just for demo

And add label through renderer.addTextLabel();

ex:

String[] date={"1-3-2012","1-4-2012","1-5-2012","1-6-2012"}; 
for (int i = 0; i < date.length; i++) 
    { 

    renderer.addTextLabel(i+1, date[i]);
    }
    renderer.setXLabelsAlign(Align.CENTER);
    renderer.setXLabels(0);
Abhi
  • 8,935
  • 7
  • 37
  • 60
  • there is no CustomLabelFormatter or something alike that lets you generate labels on the fly? this library is such a big PITA ... – hotzen Sep 21 '14 at 21:13
4

In addition to Abhi's answer, if you want to add grid for X Labels then add next row:

renderer.setShowCustomTextGrid(true);
LifeStyle
  • 411
  • 2
  • 10