2

I'm looking for a charting library that can draw heatmap charts, and has the option of displaying column label text vertically (allowing me to fit lots of columns on the screen regardless of the length of the labels)

Ideally the library would be free for a charity/educational organisation.

Here's an example of a simple heatmap with vertical labels:

enter image description here

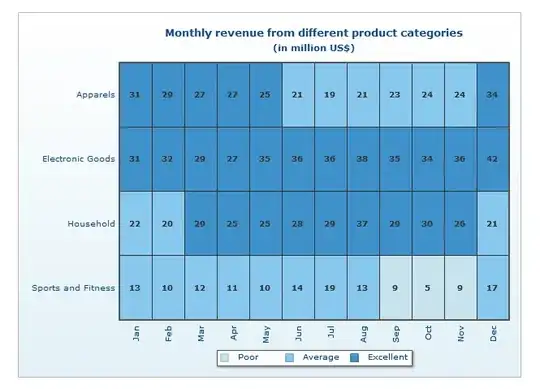
That chart was created using FusionCharts, which is not suitable as it is a flash-based product and is expensive to license.

nick
  • 1,369
  • 2
  • 13
  • 28

3 Answers3

0

I think what you are looking for is also called a TreeMap (in some circles anyway).
Check out thejit.org

Under the demos checkout the treemap and the icicle chart.

Prasad Jadhav
  • 5,090
  • 16
  • 62
  • 80
user789221
  • 51
  • 1
  • 3
0

You could always roll this yourself. Most of the table can be generated using ordinary HTML, with the exception of the vertical labels at the bottom. You could tackle that with Rafael, a JavaScript library that allows you to draw on an HTML canvas. Drawing rotated text is actually available out of the box so it won't be hard to implement.

Alexander van Oostenrijk
  • 4,644
  • 3
  • 23
  • 37
  • I'm really looking for a ready-made solution so that I don't have to roll my own, but thank you for your suggestions – nick Mar 15 '12 at 13:34
-2

At this url you can find what you are looking for heatmapjs

antonjs
  • 14,060
  • 14
  • 65
  • 91