5

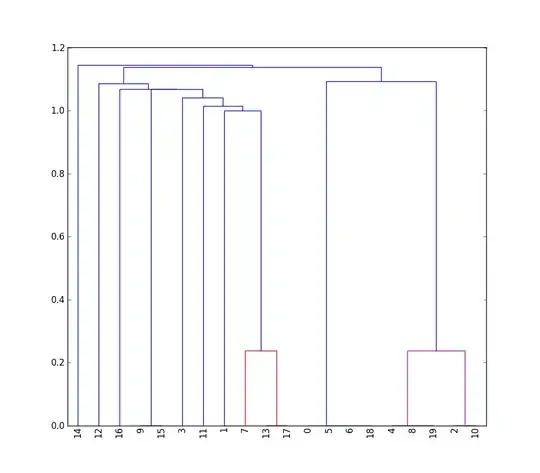
I am new to scipy but I managed to get the expected dendrogram. I am some more questions;

  1. In the dendrogram, distance between some points are 0 but its not visible due to image border. How can I remove the border and make the lower limit of y-axis to -1, so that it is clearly visible. e.g. distance between these points are 0 (13,17), (2,10), (4,8,19)
  2. How can I prune/truncate on a particular distance. for e.g. prune at 0.4
  3. How to write these clusters(after pruning) to a file

My python code:

import scipy
import pylab
import scipy.cluster.hierarchy as sch
import numpy as np

D = np.genfromtxt('LtoR.txt', dtype=None)
def llf(id):
    return str(id)
fig = pylab.figure(figsize=(10,10))
Y = sch.linkage(D, method='single')
Z1 = sch.dendrogram(Y,leaf_label_func=llf,leaf_rotation=90)
fig.show()
fig.savefig('dendrogram.png')

Dendrogram: enter image description here

thank you.

Maggie
  • 5,923
  • 8
  • 41
  • 56

3 Answers3

2

1.fig.gca().set_ylim(-0.4,1.2) Here gca() returns the current axes object, so you can give it a name

ax=fig.gca()
ax.set_ylim(-0.4,ax.get_ylim()[1])
ev-br
  • 24,968
  • 9
  • 65
  • 78
0
  1. You can prune the dendrogram and obtain your clusters using fcluster. To prune at a distance of 0.4:

    clusters = sch.fcluster(Y,t = 0.4,criterion = 'distance')

  2. The resulting array (clusters) contains the cluster label for every observation in your data. You can write the array using numpy.savetxt:

    np.savetxt('clusters.txt', clusters, delimiter=',')

user666
  • 5,231
  • 2
  • 26
  • 35
0

The border is shown because of the axis. So you can remove the border using the following command:

fig = plt.figure(figsize=(10, 8))
ax2 = fig.add_axes([0.3, 0.71, 0.6, 0.2])
Y = sch.linkage(D, method='ward')
Z2 = sch.dendrogram(Y)
ax2.set_xticks([])
ax2.set_yticks([])
ax2.axis('off')

ax.axis('off') hides the border.

Jeril
  • 7,858
  • 3
  • 52
  • 69