9

I am wanting to write code to draw a dendrogram in python. is there a simple way of going about it.

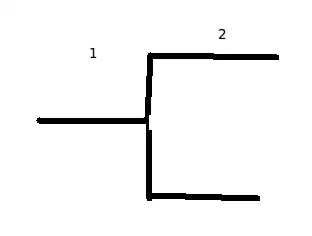
I have written code that identifies clusters in a point dataset and want to produce a dendrogram that shows the amount of clusters produced for each iteration

for example when i run my code on this dataset i get 1 cluster the first iteration

enter image description here

and 2 clusters the second iteration

enter image description here

so i would like to produce something that shows this. but don't really know where to start

enter image description here

each point has a 'label' attribute which is a list of each cluster the point was in after each iteration.

i.e. in this example some of the points label attribut is [0,0] and the others are [0,1]. so if i were to use scipy dendrogram how would i got from this to the linkage format

tjanez
  • 2,175
  • 1
  • 21
  • 14
geo_pythoncl
  • 927
  • 1
  • 7
  • 13

1 Answers1

8

SciPy does clustering and comes with a function to turn such clusterings into dendrograms. If you've written your own clustering, perhaps you can still use what SciPy offers?

gspr
  • 11,144
  • 3
  • 41
  • 74
  • i have written my own clustering routine what would i have to input into scipy to produce a dendrogram – geo_pythoncl Mar 10 '12 at 18:00
  • The `dendrogram` function expects input of the same kind as is returned by `linkage`. [The documentation](http://docs.scipy.org/doc/scipy/reference/generated/scipy.cluster.hierarchy.linkage.html#scipy.cluster.hierarchy.linkage) describes this format. – gspr Mar 10 '12 at 22:21