Not sure if it fits the question, but I just released this:
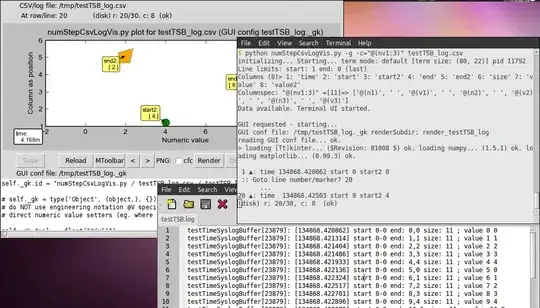
It uses Python's matplotlib, is motivated by the need to visualize syslog data in context of debugging kernel circular buffer operation (and variables) in C; and it visualizes by using CSV file format as intermediary to the logfile data (I cannot explain it better in brief - take a look at the README for more detail).
It has a "step" player accessed in terminal, and can handle "live" stdin input, but unfortunately, I cannot get a better response that 1 FPS when plot renders, so I wouldn't really call it "realtime" per se - but you can use it to eventually generate sonified videos of plot animations.