Running an iOS simulator, is there any way to get information related to memory consumption of your simulated device? just to get an idea of how good the application is and whether I am not running out of memory due to extensive usage of data in plist and things like that.
Asked
Active
Viewed 1.0k times
2 Answers
7
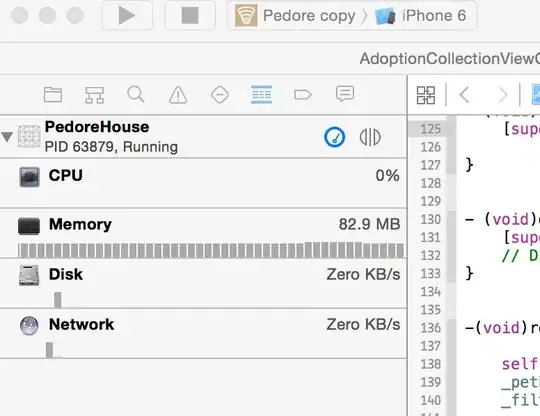
Instead of profiling while running you can check under memory tab. It will give you dynamic memory consumption. Click on Memory to reveal details . You can directly profile from that detail too. Not only Memory , you can check other CPU,DISK,NETWORK too.
Ankish Jain
- 11,305
- 5
- 36
- 34
-
Unless I'm mistaken, this is the memory usage of the program running on the Mac. I know that my iPad 6 simulator doesn't have 16 GB RAM or 3 GB free. – cjbarth Apr 12 '23 at 00:35
7
You can use XCode Profile tools to check allocation, memory leaks. And there is an activity monitor to check the resource utilization.
Product->Profile (in XCode 4.2) and then choose the option you want to profile your application.
Selvin
- 12,333
- 17
- 59
- 80
-
@Firdous Which version of Xcode You are using? in Xcode 4.2 this is the hierarchy of menus. Product-> Profile. I have changed the answer accordingly. – Selvin Feb 29 '12 at 12:54
