I want to add 99% and 95% confidence interval in XYplot.
The following is data:
X <- 1:20
Y <- c(0.5, 1.4, 2.3, 3.4, 4.5,
      3.3, 3.0, 2.1, 1.5, 0,
      0, 3.4, 4.5, 6.7, 5.3, 2.8,
      0.5, 3.4, 3.5,  3.7)
mydata <- data.frame (X, Y)
I want to identify the maximum value of Y and corresponding X value is position of median in box and whisker plot. Whenever the value of Y declines by 1 point (either left or right) is the 99% confidence interval (will be inside the box) and whenever the Y declines to 2 (both left and right), the corresponding positions in x will be represented by the whisker.
Desired plot:

Explanation.
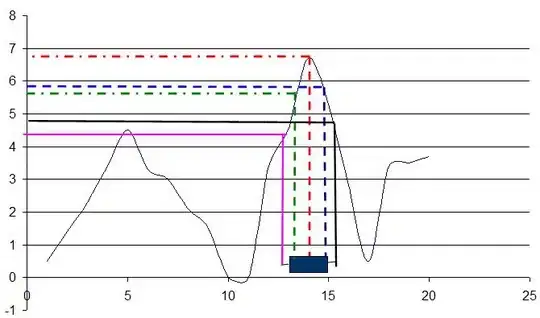
corresponding x value to max(Y) = 6.7 corresponding x value to box left = 6.7 - 1, box right = 6.7 - 1 corresponding x value to whisker left = 6.7 - 2, whisker right = 6.7 - 2